Zip Codes with the Highest Percentage of Population with a Degree in Visual and Performing Arts in Urbandale, IA
RELATED REPORTS & OPTIONS
Visual and Performing Arts
Urbandale
Compare Zip Codes
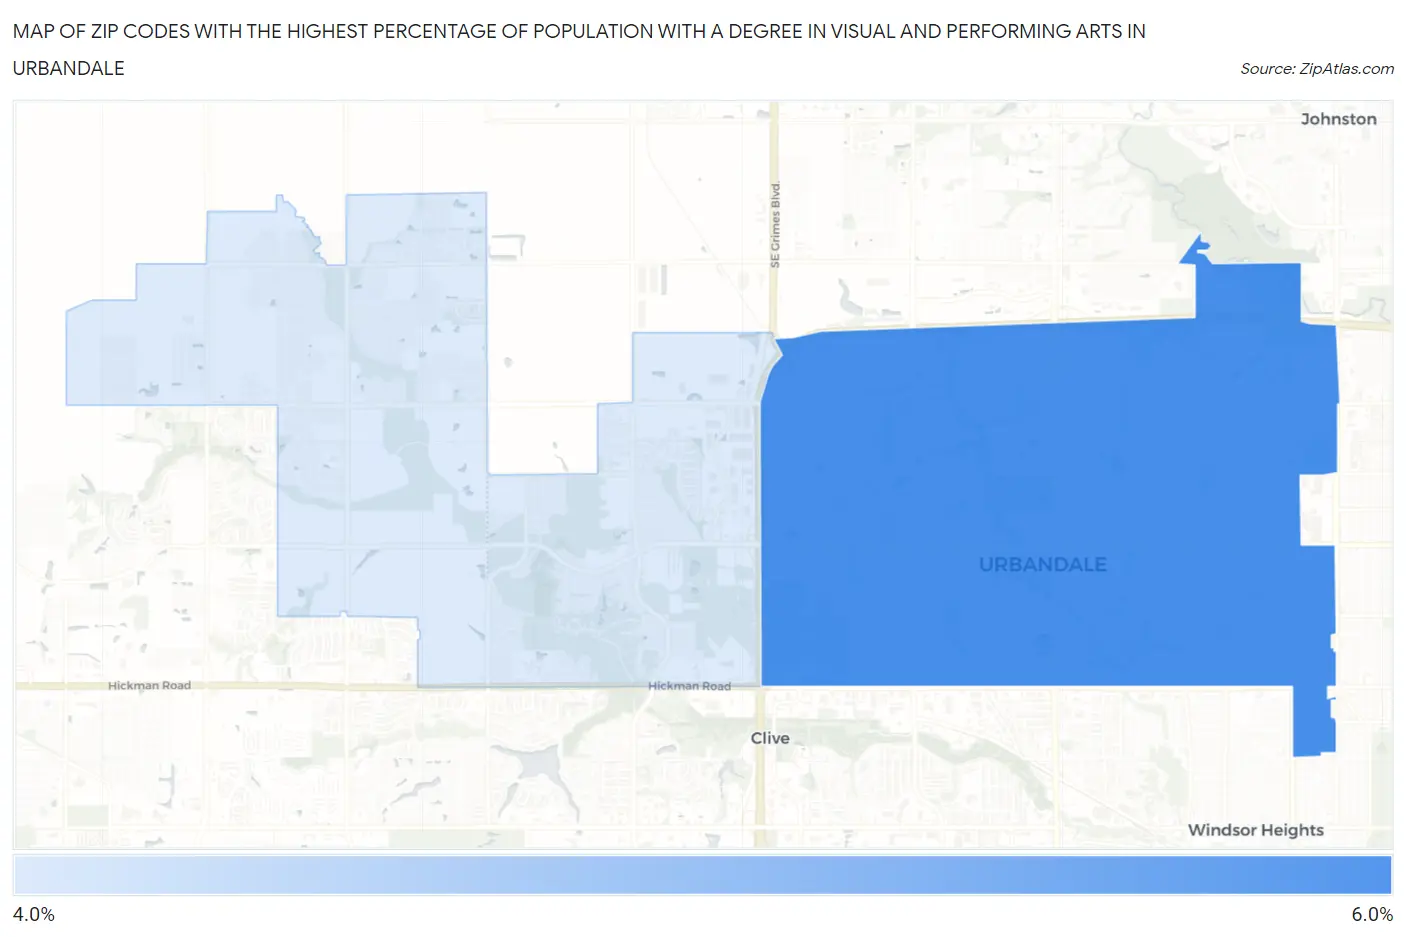
Map of Zip Codes with the Highest Percentage of Population with a Degree in Visual and Performing Arts in Urbandale
4.4%
5.2%
Zip Codes with the Highest Percentage of Population with a Degree in Visual and Performing Arts in Urbandale, IA
| Zip Code | % Graduates | vs State | vs National | |
| 1. | 50322 | 5.2% | 3.5%(+1.73)#131 | 4.3%(+0.984)#6,175 |
| 2. | 50323 | 4.4% | 3.5%(+0.874)#167 | 4.3%(+0.126)#8,150 |
1
Common Questions
What are the Top Zip Codes with the Highest Percentage of Population with a Degree in Visual and Performing Arts in Urbandale, IA?
Top Zip Codes with the Highest Percentage of Population with a Degree in Visual and Performing Arts in Urbandale, IA are:
What zip code has the Highest Percentage of Population with a Degree in Visual and Performing Arts in Urbandale, IA?
50322 has the Highest Percentage of Population with a Degree in Visual and Performing Arts in Urbandale, IA with 5.2%.
What is the Percentage of Population with a Degree in Visual and Performing Arts in Urbandale, IA?
Percentage of Population with a Degree in Visual and Performing Arts in Urbandale is 4.9%.
What is the Percentage of Population with a Degree in Visual and Performing Arts in Iowa?
Percentage of Population with a Degree in Visual and Performing Arts in Iowa is 3.5%.
What is the Percentage of Population with a Degree in Visual and Performing Arts in the United States?
Percentage of Population with a Degree in Visual and Performing Arts in the United States is 4.3%.