Zip Codes with the Highest Percentage of Population with a Degree in Visual and Performing Arts in Stone Mountain, GA
RELATED REPORTS & OPTIONS
Visual and Performing Arts
Stone Mountain
Compare Zip Codes
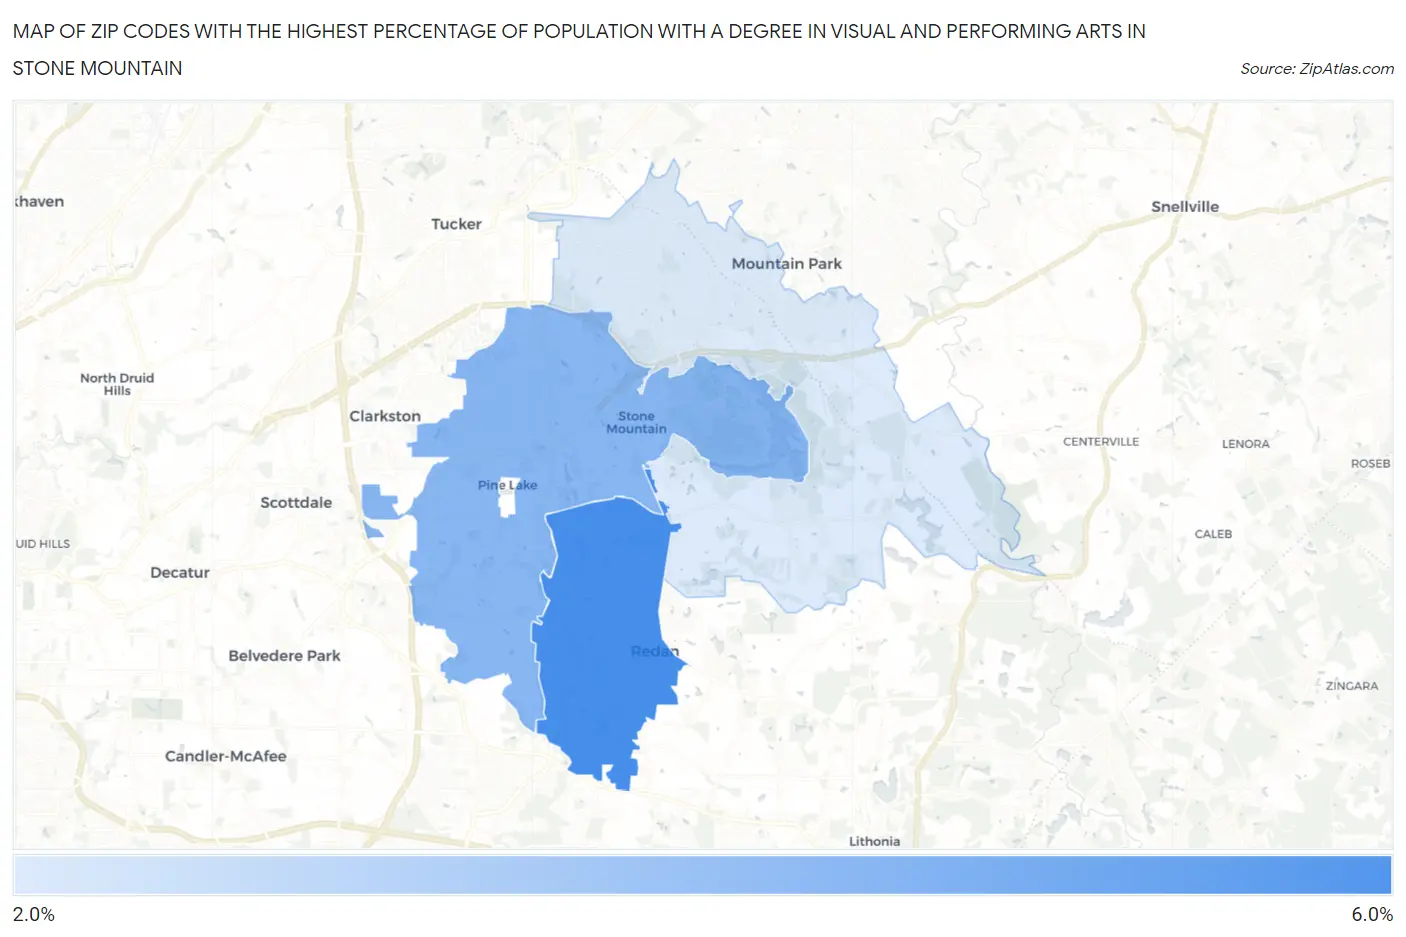
Map of Zip Codes with the Highest Percentage of Population with a Degree in Visual and Performing Arts in Stone Mountain
2.6%
5.6%
Zip Codes with the Highest Percentage of Population with a Degree in Visual and Performing Arts in Stone Mountain, GA
| Zip Code | % Graduates | vs State | vs National | |
| 1. | 30088 | 5.6% | 3.8%(+1.78)#104 | 4.3%(+1.32)#5,548 |
| 2. | 30083 | 4.3% | 3.8%(+0.475)#169 | 4.3%(+0.014)#8,448 |
| 3. | 30087 | 2.6% | 3.8%(-1.20)#310 | 4.3%(-1.66)#14,293 |
1
Common Questions
What are the Top Zip Codes with the Highest Percentage of Population with a Degree in Visual and Performing Arts in Stone Mountain, GA?
Top Zip Codes with the Highest Percentage of Population with a Degree in Visual and Performing Arts in Stone Mountain, GA are:
What zip code has the Highest Percentage of Population with a Degree in Visual and Performing Arts in Stone Mountain, GA?
30088 has the Highest Percentage of Population with a Degree in Visual and Performing Arts in Stone Mountain, GA with 5.6%.
What is the Percentage of Population with a Degree in Visual and Performing Arts in Stone Mountain, GA?
Percentage of Population with a Degree in Visual and Performing Arts in Stone Mountain is 10.1%.
What is the Percentage of Population with a Degree in Visual and Performing Arts in Georgia?
Percentage of Population with a Degree in Visual and Performing Arts in Georgia is 3.8%.
What is the Percentage of Population with a Degree in Visual and Performing Arts in the United States?
Percentage of Population with a Degree in Visual and Performing Arts in the United States is 4.3%.