Zip Codes with the Highest Percentage of Population Employed in Accommodation & Food Services in Stone Mountain, GA
RELATED REPORTS & OPTIONS
Accommodation & Food Services
Stone Mountain
Compare Zip Codes
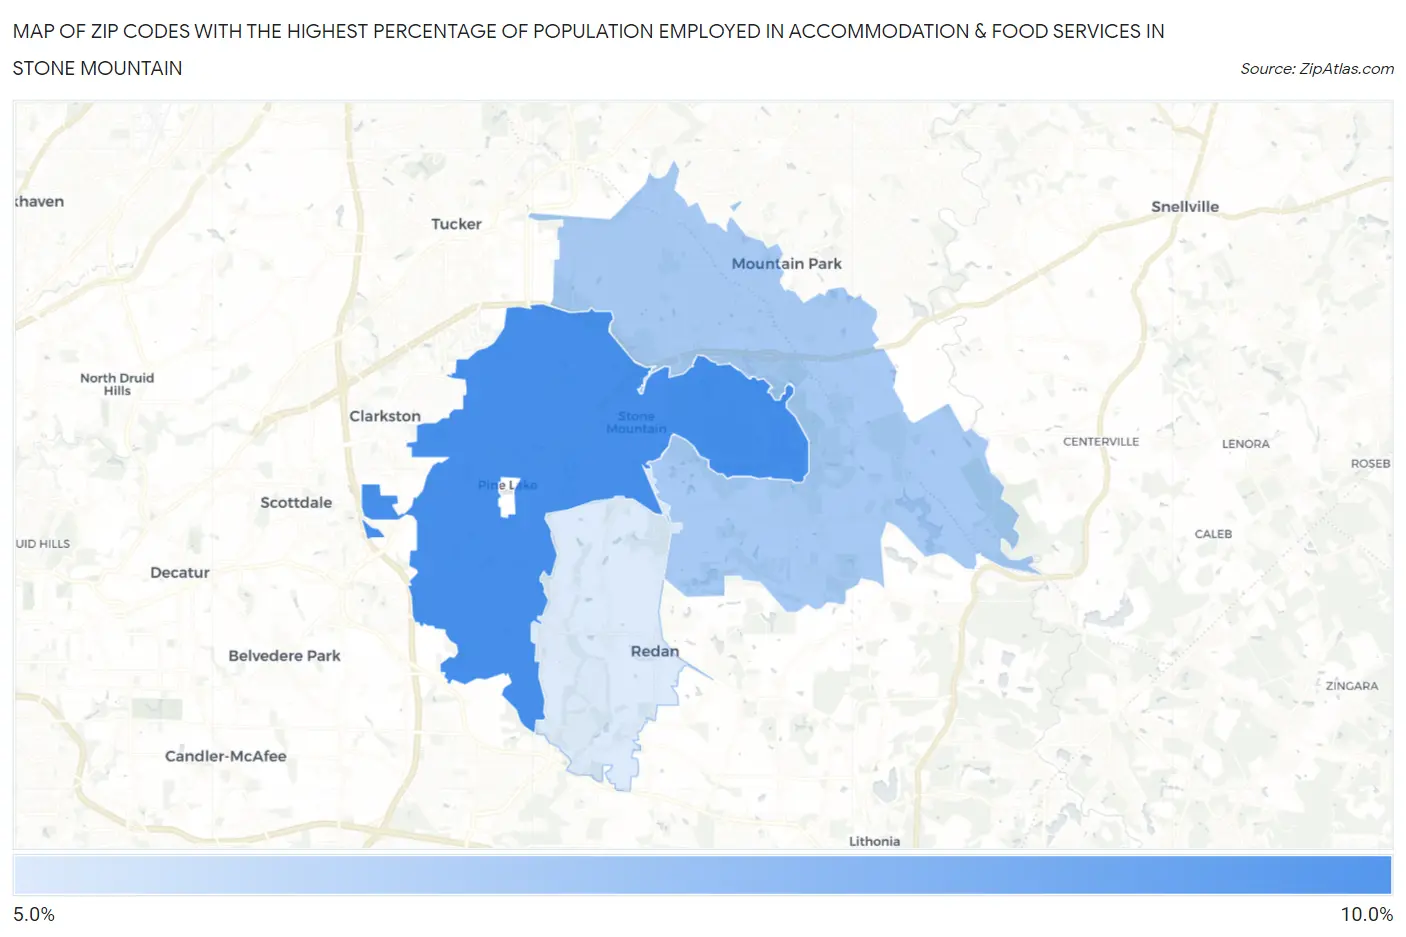
Map of Zip Codes with the Highest Percentage of Population Employed in Accommodation & Food Services in Stone Mountain
5.1%
9.6%
Zip Codes with the Highest Percentage of Population Employed in Accommodation & Food Services in Stone Mountain, GA
| Zip Code | % Employed | vs State | vs National | |
| 1. | 30083 | 9.6% | 7.2%(+2.41)#118 | 6.9%(+2.73)#5,049 |
| 2. | 30087 | 6.7% | 7.2%(-0.503)#301 | 6.9%(-0.178)#11,199 |
| 3. | 30088 | 5.1% | 7.2%(-2.06)#423 | 6.9%(-1.74)#16,305 |
1
Common Questions
What are the Top Zip Codes with the Highest Percentage of Population Employed in Accommodation & Food Services in Stone Mountain, GA?
Top Zip Codes with the Highest Percentage of Population Employed in Accommodation & Food Services in Stone Mountain, GA are:
What zip code has the Highest Percentage of Population Employed in Accommodation & Food Services in Stone Mountain, GA?
30083 has the Highest Percentage of Population Employed in Accommodation & Food Services in Stone Mountain, GA with 9.6%.
What is the Percentage of Population Employed in Accommodation & Food Services in Stone Mountain, GA?
Percentage of Population Employed in Accommodation & Food Services in Stone Mountain is 9.9%.
What is the Percentage of Population Employed in Accommodation & Food Services in Georgia?
Percentage of Population Employed in Accommodation & Food Services in Georgia is 7.2%.
What is the Percentage of Population Employed in Accommodation & Food Services in the United States?
Percentage of Population Employed in Accommodation & Food Services in the United States is 6.9%.