Zip Codes with the Highest Percentage of Population Employed in Security & Protection in Jonesboro, GA
RELATED REPORTS & OPTIONS
Security & Protection
Jonesboro
Compare Zip Codes
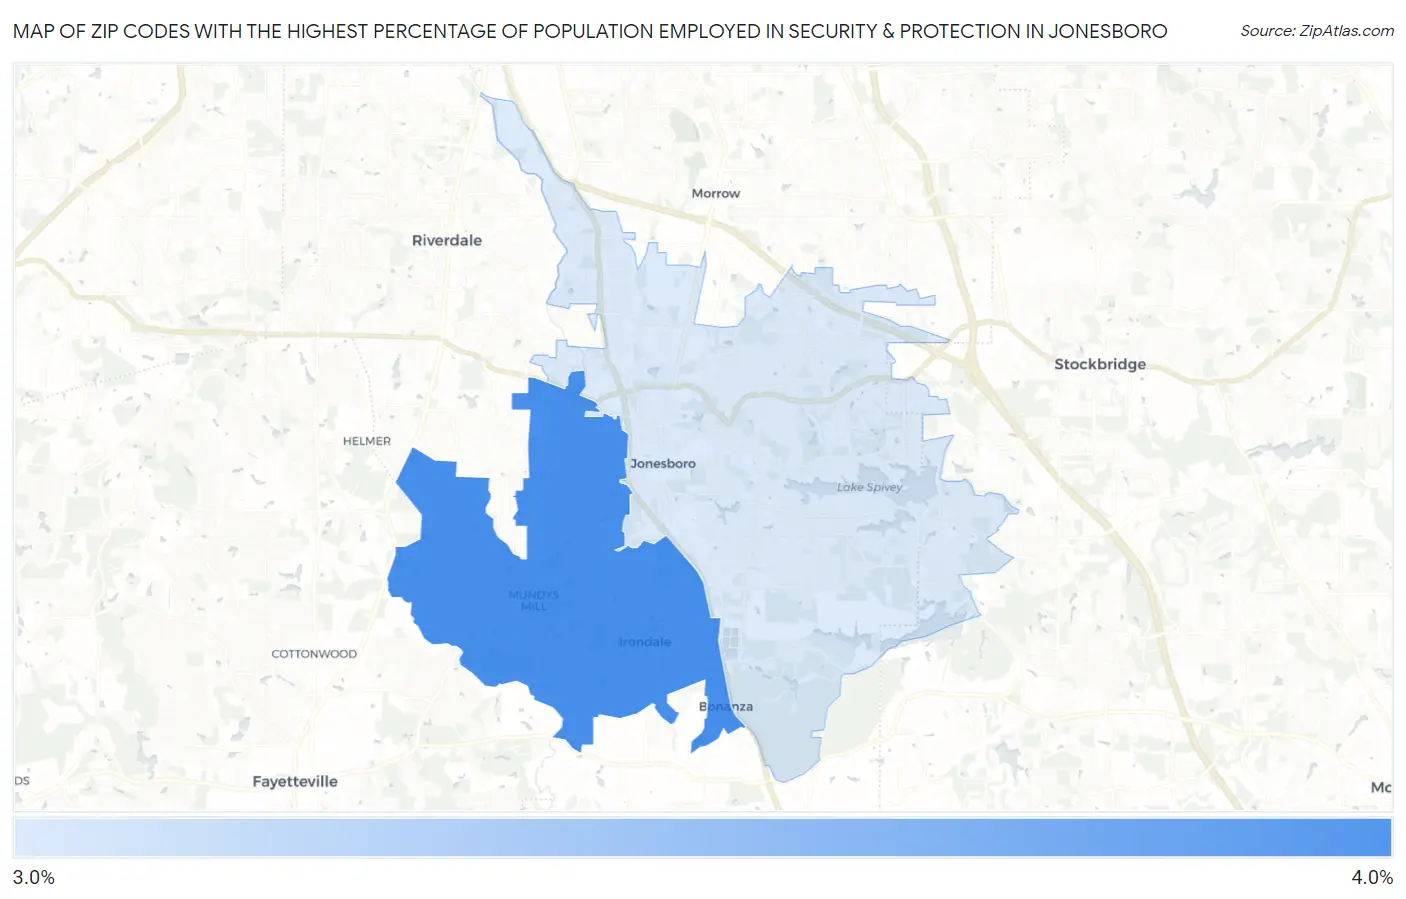
Map of Zip Codes with the Highest Percentage of Population Employed in Security & Protection in Jonesboro
3.7%
3.8%
Zip Codes with the Highest Percentage of Population Employed in Security & Protection in Jonesboro, GA
| Zip Code | % Employed | vs State | vs National | |
| 1. | 30238 | 3.8% | 2.2%(+1.62)#145 | 2.1%(+1.64)#4,927 |
| 2. | 30236 | 3.7% | 2.2%(+1.54)#153 | 2.1%(+1.56)#5,115 |
1
Common Questions
What are the Top Zip Codes with the Highest Percentage of Population Employed in Security & Protection in Jonesboro, GA?
Top Zip Codes with the Highest Percentage of Population Employed in Security & Protection in Jonesboro, GA are:
What zip code has the Highest Percentage of Population Employed in Security & Protection in Jonesboro, GA?
30238 has the Highest Percentage of Population Employed in Security & Protection in Jonesboro, GA with 3.8%.
What is the Percentage of Population Employed in Security & Protection in Jonesboro, GA?
Percentage of Population Employed in Security & Protection in Jonesboro is 4.4%.
What is the Percentage of Population Employed in Security & Protection in Georgia?
Percentage of Population Employed in Security & Protection in Georgia is 2.2%.
What is the Percentage of Population Employed in Security & Protection in the United States?
Percentage of Population Employed in Security & Protection in the United States is 2.1%.