Zip Codes with the Highest Percentage of Population Employed in Architecture & Engineering in Jonesboro, GA
RELATED REPORTS & OPTIONS
Architecture & Engineering
Jonesboro
Compare Zip Codes
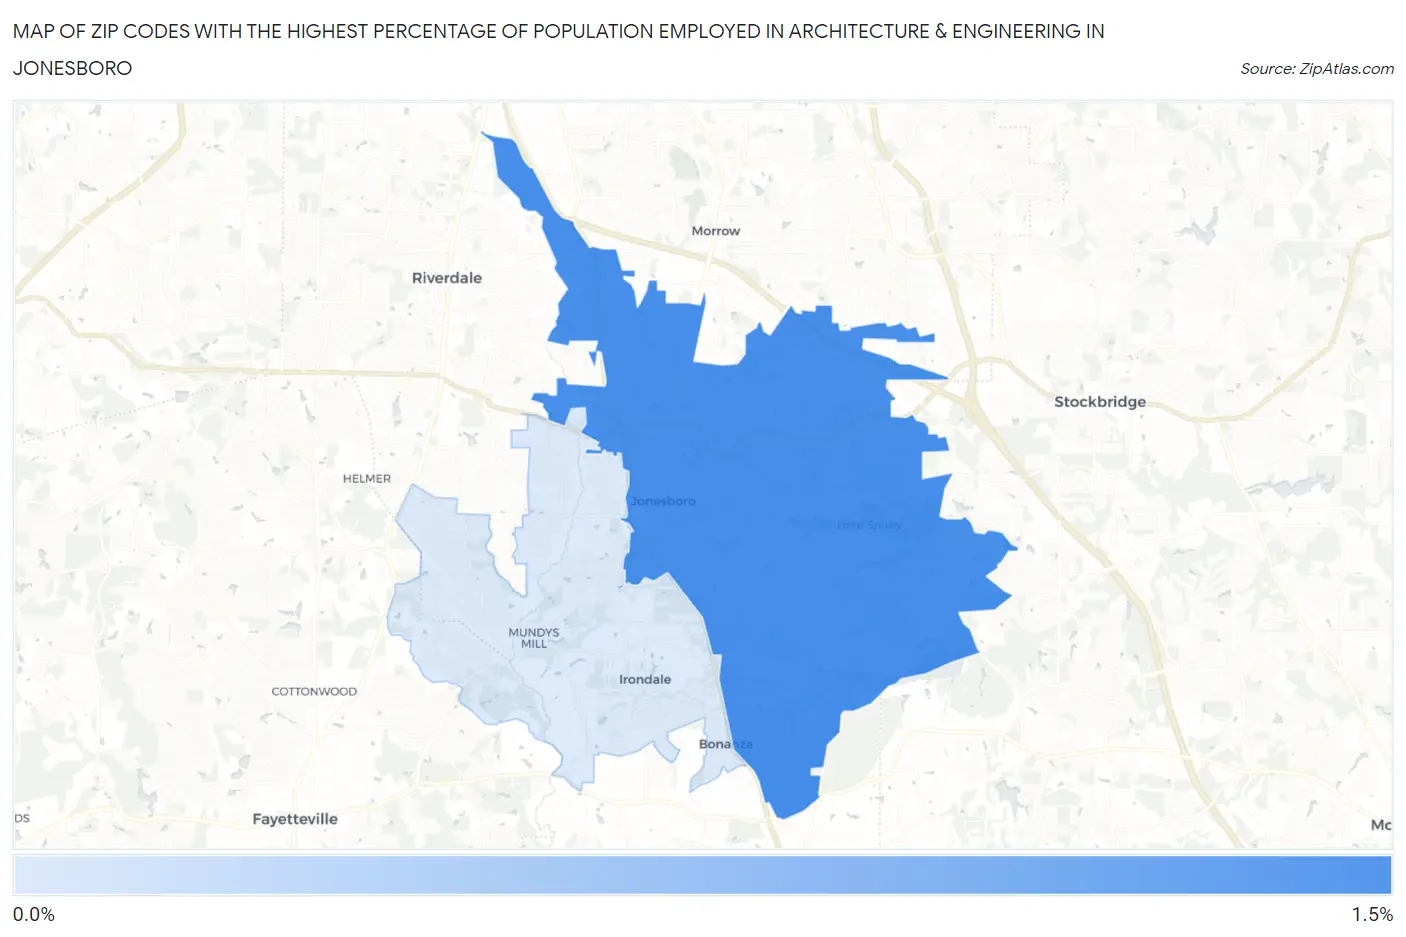
Map of Zip Codes with the Highest Percentage of Population Employed in Architecture & Engineering in Jonesboro
0.32%
1.3%
Zip Codes with the Highest Percentage of Population Employed in Architecture & Engineering in Jonesboro, GA
| Zip Code | % Employed | vs State | vs National | |
| 1. | 30236 | 1.3% | 1.8%(-0.501)#280 | 2.1%(-0.855)#14,343 |
| 2. | 30238 | 0.32% | 1.8%(-1.48)#474 | 2.1%(-1.83)#21,444 |
1
Common Questions
What are the Top Zip Codes with the Highest Percentage of Population Employed in Architecture & Engineering in Jonesboro, GA?
Top Zip Codes with the Highest Percentage of Population Employed in Architecture & Engineering in Jonesboro, GA are:
What zip code has the Highest Percentage of Population Employed in Architecture & Engineering in Jonesboro, GA?
30236 has the Highest Percentage of Population Employed in Architecture & Engineering in Jonesboro, GA with 1.3%.
What is the Percentage of Population Employed in Architecture & Engineering in Jonesboro, GA?
Percentage of Population Employed in Architecture & Engineering in Jonesboro is 0.33%.
What is the Percentage of Population Employed in Architecture & Engineering in Georgia?
Percentage of Population Employed in Architecture & Engineering in Georgia is 1.8%.
What is the Percentage of Population Employed in Architecture & Engineering in the United States?
Percentage of Population Employed in Architecture & Engineering in the United States is 2.1%.