Pennsylvania German vs Immigrants from Serbia Disability Age Under 5

COMPARE

Pennsylvania German
Race
Ancestry
AfghanAfricanAlaska NativeAlaskan AthabascanAlbanianAleutAlsatianAmericanApacheArabArapahoArgentineanArmenianAssyrian/Chaldean/SyriacAustralianAustrianBahamianBangladeshiBarbadianBasqueBelgianBelizeanBermudanBhutaneseBlackfeetBolivianBrazilianBritishBritish West IndianBulgarianBurmeseCajunCambodianCanadianCape VerdeanCarpatho RusynCelticCentral AmericanCentral American IndianCherokeeCheyenneChickasawChileanChineseChippewaChoctawColombianColvilleComancheCosta RicanCreeCreekCroatianCrowCubanCypriotCzechCzechoslovakianDanishDelawareDominicanDutchDutch West IndianEastern EuropeanEcuadorianEgyptianEnglishEstonianEthiopianEuropeanFijianFilipinoFinnishFrenchFrench American IndianFrench CanadianGermanGerman RussianGhanaianGreekGuamanian/ChamorroGuatemalanGuyaneseHaitianHmongHonduranHopiHoumaHungarianIcelanderIndian (Asian)IndonesianInupiatIranianIraqiIrishIroquoisIsraeliItalianJamaicanJapaneseJordanianKenyanKiowaKoreanLaotianLatvianLebaneseLiberianLithuanianLumbeeLuxembourgerMacedonianMalaysianMalteseMarshalleseMenomineeMexicanMexican American IndianMongolianMoroccanNative HawaiianNavajoNepaleseNew ZealanderNicaraguanNigerianNorthern EuropeanNorwegianOkinawanOsageOttawaPaiutePakistaniPalestinianPanamanianParaguayanPennsylvania GermanPeruvianPimaPolishPortuguesePotawatomiPuebloPuerto RicanPuget Sound SalishRomanianRussianSalvadoranSamoanScandinavianScotch-IrishScottishSeminoleSenegaleseSerbianShoshoneSierra LeoneanSiouxSlavicSlovakSloveneSomaliSouth AfricanSouth AmericanSouth American IndianSoviet UnionSpaniardSpanishSpanish AmericanSpanish American IndianSri LankanSubsaharan AfricanSudaneseSwedishSwissSyrianTaiwaneseThaiTlingit-HaidaTohono O'OdhamTonganTrinidadian and TobagonianTsimshianTurkishU.S. Virgin IslanderUgandanUkrainianUruguayanUteVenezuelanVietnameseWelshWest IndianYakamaYaquiYugoslavianYumanYup'ikZimbabwean
Immigration
NonimmigrantsImmigrantsAfghanistanAfricaAlbaniaArgentinaArmeniaAsiaAustraliaAustriaBahamasBangladeshBarbadosBelarusBelgiumBelizeBoliviaBosnia and HerzegovinaBrazilBulgariaBurma/MyanmarCabo VerdeCambodiaCameroonCanadaCaribbeanCentral AmericaChileChinaColombiaCongoCosta RicaCroatiaCubaCzechoslovakiaDenmarkDominicaDominican RepublicEastern AfricaEastern AsiaEastern EuropeEcuadorEgyptEl SalvadorEnglandEritreaEthiopiaEuropeFijiFranceGermanyGhanaGreeceGrenadaGuatemalaGuyanaHaitiHondurasHong KongHungaryIndiaIndonesiaIranIraqIrelandIsraelItalyJamaicaJapanJordanKazakhstanKenyaKoreaKuwaitLaosLatin AmericaLatviaLebanonLiberiaLithuaniaMalaysiaMexicoMicronesiaMiddle AfricaMoldovaMoroccoNepalNetherlandsNicaraguaNigeriaNorth AmericaNorth MacedoniaNorthern AfricaNorthern EuropeNorwayOceaniaPakistanPanamaPeruPhilippinesPolandPortugalRomaniaRussiaSaudi ArabiaScotlandSenegalSierra LeoneSingaporeSomaliaSouth AfricaSouth AmericaSouth Central AsiaSouth Eastern AsiaSouthern EuropeSpainSri LankaSt. Vincent and the GrenadinesSudanSwedenSwitzerlandSyriaTaiwanThailandTrinidad and TobagoTurkeyUgandaUkraineUruguayUzbekistanVenezuelaVietnamWest IndiesWestern AfricaWestern AsiaWestern EuropeYemenZaireZimbabweAzores
Immigrants from Serbia
Race
Ancestry
AfghanAfricanAlaska NativeAlaskan AthabascanAlbanianAleutAlsatianAmericanApacheArabArapahoArgentineanArmenianAssyrian/Chaldean/SyriacAustralianAustrianBahamianBangladeshiBarbadianBasqueBelgianBelizeanBermudanBhutaneseBlackfeetBolivianBrazilianBritishBritish West IndianBulgarianBurmeseCajunCambodianCanadianCape VerdeanCarpatho RusynCelticCentral AmericanCentral American IndianCherokeeCheyenneChickasawChileanChineseChippewaChoctawColombianColvilleComancheCosta RicanCreeCreekCroatianCrowCubanCypriotCzechCzechoslovakianDanishDelawareDominicanDutchDutch West IndianEastern EuropeanEcuadorianEgyptianEnglishEstonianEthiopianEuropeanFijianFilipinoFinnishFrenchFrench American IndianFrench CanadianGermanGerman RussianGhanaianGreekGuamanian/ChamorroGuatemalanGuyaneseHaitianHmongHonduranHopiHoumaHungarianIcelanderIndian (Asian)IndonesianInupiatIranianIraqiIrishIroquoisIsraeliItalianJamaicanJapaneseJordanianKenyanKiowaKoreanLaotianLatvianLebaneseLiberianLithuanianLumbeeLuxembourgerMacedonianMalaysianMalteseMarshalleseMenomineeMexicanMexican American IndianMongolianMoroccanNative HawaiianNavajoNepaleseNew ZealanderNicaraguanNigerianNorthern EuropeanNorwegianOkinawanOsageOttawaPaiutePakistaniPalestinianPanamanianParaguayanPeruvianPimaPolishPortuguesePotawatomiPuebloPuerto RicanPuget Sound SalishRomanianRussianSalvadoranSamoanScandinavianScotch-IrishScottishSeminoleSenegaleseSerbianShoshoneSierra LeoneanSiouxSlavicSlovakSloveneSomaliSouth AfricanSouth AmericanSouth American IndianSoviet UnionSpaniardSpanishSpanish AmericanSpanish American IndianSri LankanSubsaharan AfricanSudaneseSwedishSwissSyrianTaiwaneseThaiTlingit-HaidaTohono O'OdhamTonganTrinidadian and TobagonianTsimshianTurkishU.S. Virgin IslanderUgandanUkrainianUruguayanUteVenezuelanVietnameseWelshWest IndianYakamaYaquiYugoslavianYumanYup'ikZimbabwean
Immigration
NonimmigrantsImmigrantsAfghanistanAfricaAlbaniaArgentinaArmeniaAsiaAustraliaAustriaBahamasBangladeshBarbadosBelarusBelgiumBelizeBoliviaBosnia and HerzegovinaBrazilBulgariaBurma/MyanmarCabo VerdeCambodiaCameroonCanadaCaribbeanCentral AmericaChileChinaColombiaCongoCosta RicaCroatiaCubaCzechoslovakiaDenmarkDominicaDominican RepublicEastern AfricaEastern AsiaEastern EuropeEcuadorEgyptEl SalvadorEnglandEritreaEthiopiaEuropeFijiFranceGermanyGhanaGreeceGrenadaGuatemalaGuyanaHaitiHondurasHong KongHungaryIndiaIndonesiaIranIraqIrelandIsraelItalyJamaicaJapanJordanKazakhstanKenyaKoreaKuwaitLaosLatin AmericaLatviaLebanonLiberiaLithuaniaMalaysiaMexicoMicronesiaMiddle AfricaMoldovaMoroccoNepalNetherlandsNicaraguaNigeriaNorth AmericaNorth MacedoniaNorthern AfricaNorthern EuropeNorwayOceaniaPakistanPanamaPeruPhilippinesPolandPortugalRomaniaRussiaSaudi ArabiaScotlandSenegalSerbiaSierra LeoneSingaporeSomaliaSouth AfricaSouth AmericaSouth Central AsiaSouth Eastern AsiaSouthern EuropeSpainSri LankaSt. Vincent and the GrenadinesSudanSwedenSwitzerlandSyriaTaiwanThailandTrinidad and TobagoTurkeyUgandaUkraineUruguayUzbekistanVenezuelaVietnamWest IndiesWestern AfricaWestern AsiaWestern EuropeYemenZaireZimbabweAzores
Disability Age Under 5
Income
Poverty
Unemployment
Labor Participation
Family Structure
Vehicle Availability
Education Level
Disability

Disability Age Under 5 Comparison

Pennsylvania Germans

Immigrants from Serbia

Tragic
Excellent
1.9%
DISABILITY AGE UNDER 5
0.0/ 100
METRIC RATING
335th/ 347
METRIC RANK
1.2%
DISABILITY AGE UNDER 5
87.6/ 100
METRIC RATING
131st/ 347
METRIC RANK

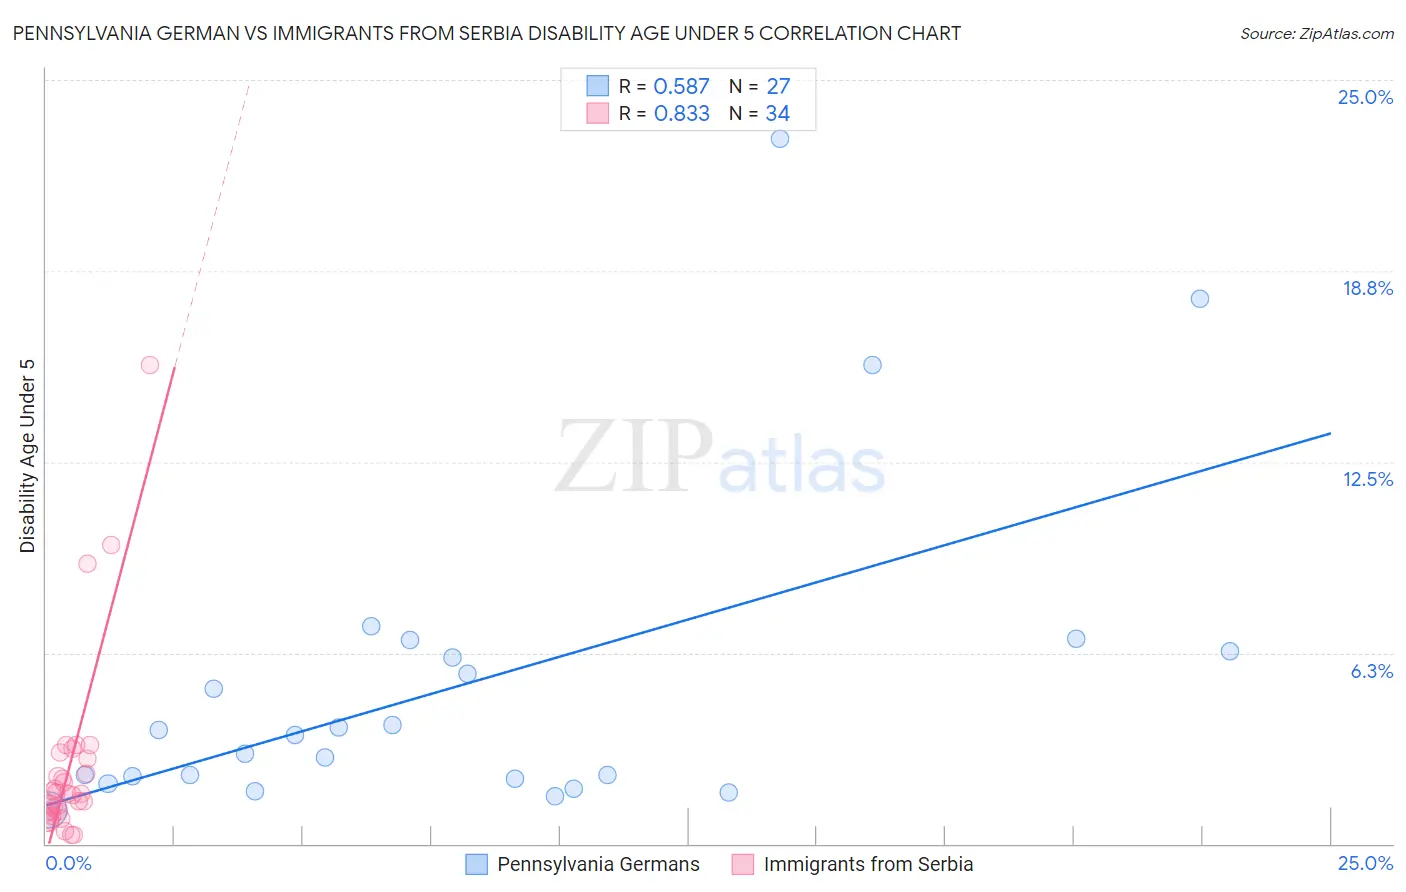
Pennsylvania German vs Immigrants from Serbia Disability Age Under 5 Correlation Chart

The statistical analysis conducted on geographies consisting of 141,367,234 people shows a substantial positive correlation between the proportion of Pennsylvania Germans and percentage of population with a disability under the age of 5 in the United States with a correlation coefficient (R) of 0.587 and weighted average of 1.9%. Similarly, the statistical analysis conducted on geographies consisting of 93,075,533 people shows a very strong positive correlation between the proportion of Immigrants from Serbia and percentage of population with a disability under the age of 5 in the United States with a correlation coefficient (R) of 0.833 and weighted average of 1.2%, a difference of 64.5%.
Pennsylvania German vs Immigrants from Serbia Disability Age Under 5

Disability Age Under 5 Correlation Summary

MeasurementPennsylvania GermanImmigrants from Serbia
Minimum1.1%0.28%
Maximum23.1%15.7%
Range22.0%15.4%
Mean5.3%2.5%
Median3.5%1.6%
Interquartile 25% (IQ1)2.1%1.1%
Interquartile 75% (IQ3)6.3%2.8%
Interquartile Range (IQR)4.2%1.7%
Standard Deviation (Sample)5.3%3.1%
Standard Deviation (Population)5.2%3.1%

Similar Demographics by Disability Age Under 5

Demographics Similar to Pennsylvania Germans by Disability Age Under 5

In terms of disability age under 5, the demographic groups most similar to Pennsylvania Germans are Native/Alaskan (1.9%, a difference of 0.38%), Dutch West Indian (1.9%, a difference of 0.78%), Paraguayan (2.0%, a difference of 1.3%), Chippewa (1.9%, a difference of 3.7%), and French Canadian (1.9%, a difference of 3.8%).
DemographicsRating | RankDisability Age Under 5
Americans
0.0
/100
|
#328
Tragic
1.9%
Houma
0.0
/100
|
#329
Tragic
1.9%
Choctaw
0.0
/100
|
#330
Tragic
1.9%
French Canadians
0.0
/100
|
#331
Tragic
1.9%
Chippewa
0.0
/100
|
#332
Tragic
1.9%
Dutch West Indians
0.0
/100
|
#333
Tragic
1.9%
Natives/Alaskans
0.0
/100
|
#334
Tragic
1.9%
Pennsylvania Germans
0.0
/100
|
#335
Tragic
1.9%
Paraguayans
0.0
/100
|
#336
Tragic
2.0%
Apache
0.0
/100
|
#337
Tragic
2.0%
Tohono O'odham
0.0
/100
|
#338
Tragic
2.2%
Immigrants | Azores
0.0
/100
|
#339
Tragic
2.2%
Menominee
0.0
/100
|
#340
Tragic
2.3%
Tsimshian
0.0
/100
|
#341
Tragic
2.4%
Alaska Natives
0.0
/100
|
#342
Tragic
2.9%

Demographics Similar to Immigrants from Serbia by Disability Age Under 5

In terms of disability age under 5, the demographic groups most similar to Immigrants from Serbia are Korean (1.2%, a difference of 0.020%), Immigrants from Eastern Europe (1.2%, a difference of 0.070%), Immigrants (1.2%, a difference of 0.090%), Immigrants from Romania (1.2%, a difference of 0.19%), and Immigrants from France (1.2%, a difference of 0.19%).
DemographicsRating | RankDisability Age Under 5
Immigrants | Cambodia
90.5
/100
|
#124
Exceptional
1.2%
Japanese
90.3
/100
|
#125
Exceptional
1.2%
Central Americans
89.7
/100
|
#126
Excellent
1.2%
Immigrants | Romania
88.4
/100
|
#127
Excellent
1.2%
Immigrants | France
88.4
/100
|
#128
Excellent
1.2%
Immigrants | Immigrants
88.0
/100
|
#129
Excellent
1.2%
Koreans
87.7
/100
|
#130
Excellent
1.2%
Immigrants | Serbia
87.6
/100
|
#131
Excellent
1.2%
Immigrants | Eastern Europe
87.3
/100
|
#132
Excellent
1.2%
Immigrants | Spain
86.5
/100
|
#133
Excellent
1.2%
Argentineans
85.7
/100
|
#134
Excellent
1.2%
Fijians
84.7
/100
|
#135
Excellent
1.2%
Moroccans
83.6
/100
|
#136
Excellent
1.2%
Immigrants | Eastern Africa
83.1
/100
|
#137
Excellent
1.2%
Immigrants | Czechoslovakia
82.8
/100
|
#138
Excellent
1.2%