Immigrants from Trinidad and Tobago vs Samoan Disability Age Under 5
COMPARE
Immigrants from Trinidad and Tobago
Samoan
Disability Age Under 5
Disability Age Under 5 Comparison
Immigrants from Trinidad and Tobago
Samoans
1.1%
DISABILITY AGE UNDER 5
98.0/ 100
METRIC RATING
80th/ 347
METRIC RANK
1.2%
DISABILITY AGE UNDER 5
77.7/ 100
METRIC RATING
146th/ 347
METRIC RANK
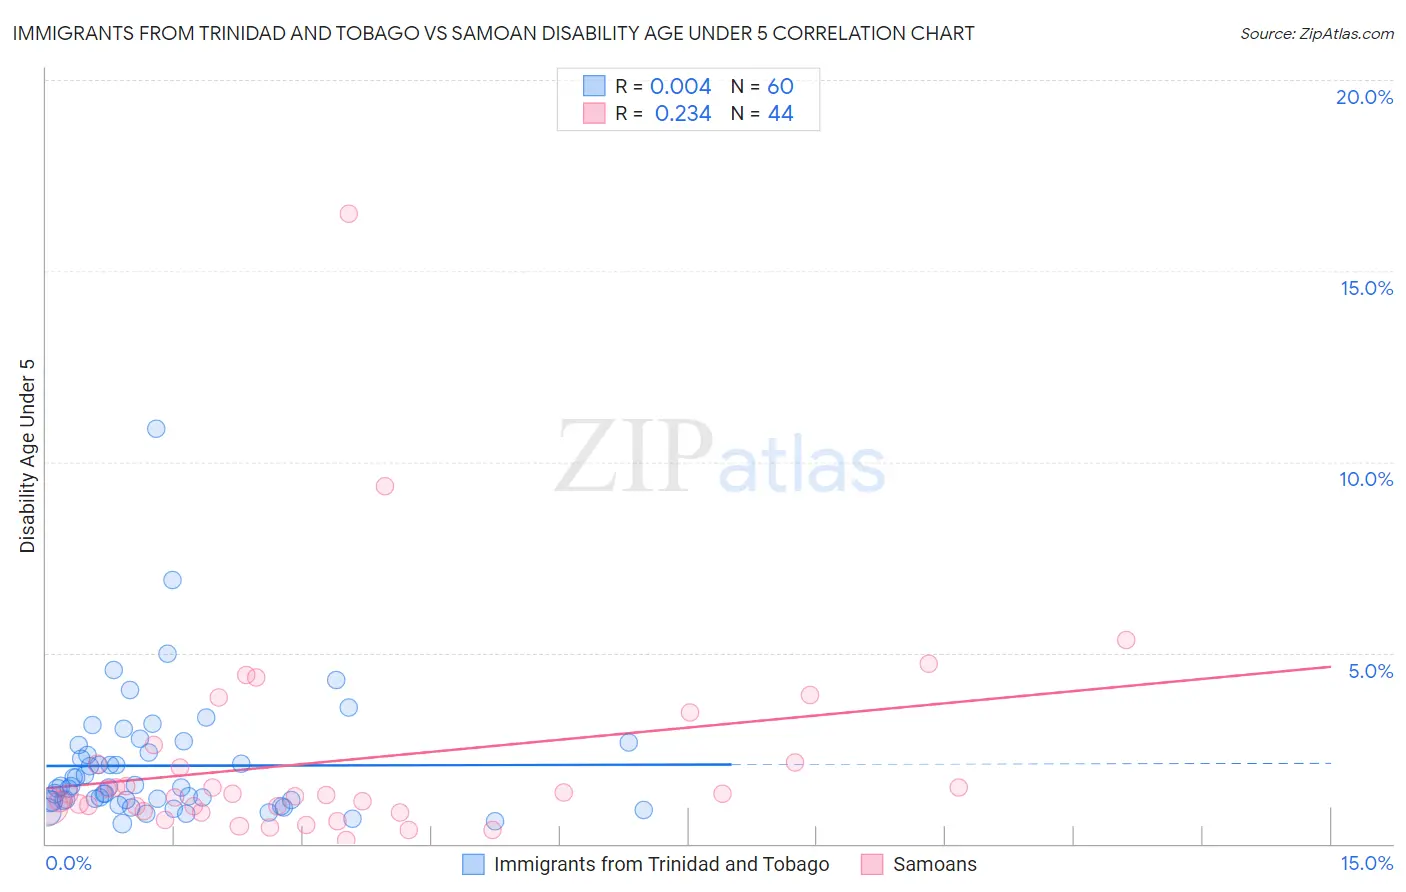
Immigrants from Trinidad and Tobago vs Samoan Disability Age Under 5 Correlation Chart
The statistical analysis conducted on geographies consisting of 139,979,956 people shows no correlation between the proportion of Immigrants from Trinidad and Tobago and percentage of population with a disability under the age of 5 in the United States with a correlation coefficient (R) of 0.004 and weighted average of 1.1%. Similarly, the statistical analysis conducted on geographies consisting of 152,568,773 people shows a weak positive correlation between the proportion of Samoans and percentage of population with a disability under the age of 5 in the United States with a correlation coefficient (R) of 0.234 and weighted average of 1.2%, a difference of 6.6%.
Disability Age Under 5 Correlation Summary
| Measurement | Immigrants from Trinidad and Tobago | Samoan |
| Minimum | 0.53% | 0.11% |
| Maximum | 10.9% | 16.5% |
| Range | 10.3% | 16.4% |
| Mean | 2.0% | 2.2% |
| Median | 1.5% | 1.3% |
| Interquartile 25% (IQ1) | 1.1% | 0.91% |
| Interquartile 75% (IQ3) | 2.5% | 2.1% |
| Interquartile Range (IQR) | 1.4% | 1.2% |
| Standard Deviation (Sample) | 1.7% | 2.8% |
| Standard Deviation (Population) | 1.7% | 2.8% |
Similar Demographics by Disability Age Under 5
Demographics Similar to Immigrants from Trinidad and Tobago by Disability Age Under 5
In terms of disability age under 5, the demographic groups most similar to Immigrants from Trinidad and Tobago are Hmong (1.1%, a difference of 0.020%), Turkish (1.1%, a difference of 0.020%), West Indian (1.1%, a difference of 0.040%), Immigrants from Jordan (1.1%, a difference of 0.13%), and Immigrants from Syria (1.1%, a difference of 0.14%).
| Demographics | Rating | Rank | Disability Age Under 5 |
| Immigrants | Sri Lanka | 98.5 /100 | #73 | Exceptional 1.1% |
| Jordanians | 98.5 /100 | #74 | Exceptional 1.1% |
| Immigrants | Pakistan | 98.4 /100 | #75 | Exceptional 1.1% |
| Immigrants | Burma/Myanmar | 98.2 /100 | #76 | Exceptional 1.1% |
| Immigrants | Denmark | 98.1 /100 | #77 | Exceptional 1.1% |
| West Indians | 98.0 /100 | #78 | Exceptional 1.1% |
| Hmong | 98.0 /100 | #79 | Exceptional 1.1% |
| Immigrants | Trinidad and Tobago | 98.0 /100 | #80 | Exceptional 1.1% |
| Turks | 98.0 /100 | #81 | Exceptional 1.1% |
| Immigrants | Jordan | 97.9 /100 | #82 | Exceptional 1.1% |
| Immigrants | Syria | 97.9 /100 | #83 | Exceptional 1.1% |
| Immigrants | Zaire | 97.8 /100 | #84 | Exceptional 1.1% |
| Sudanese | 97.7 /100 | #85 | Exceptional 1.1% |
| Okinawans | 97.6 /100 | #86 | Exceptional 1.1% |
| Ugandans | 97.5 /100 | #87 | Exceptional 1.1% |
Demographics Similar to Samoans by Disability Age Under 5
In terms of disability age under 5, the demographic groups most similar to Samoans are Immigrants from Zimbabwe (1.2%, a difference of 0.040%), Icelander (1.2%, a difference of 0.18%), Ghanaian (1.2%, a difference of 0.19%), Alsatian (1.2%, a difference of 0.22%), and Immigrants from Middle Africa (1.2%, a difference of 0.22%).
| Demographics | Rating | Rank | Disability Age Under 5 |
| New Zealanders | 81.4 /100 | #139 | Excellent 1.2% |
| Somalis | 80.8 /100 | #140 | Excellent 1.2% |
| Immigrants | Honduras | 80.4 /100 | #141 | Excellent 1.2% |
| Immigrants | Colombia | 79.3 /100 | #142 | Good 1.2% |
| Alsatians | 79.3 /100 | #143 | Good 1.2% |
| Immigrants | Middle Africa | 79.3 /100 | #144 | Good 1.2% |
| Immigrants | Zimbabwe | 77.9 /100 | #145 | Good 1.2% |
| Samoans | 77.7 /100 | #146 | Good 1.2% |
| Icelanders | 76.3 /100 | #147 | Good 1.2% |
| Ghanaians | 76.3 /100 | #148 | Good 1.2% |
| Kenyans | 75.9 /100 | #149 | Good 1.2% |
| South Americans | 75.6 /100 | #150 | Good 1.2% |
| Yaqui | 74.8 /100 | #151 | Good 1.2% |
| Hondurans | 72.5 /100 | #152 | Good 1.2% |
| Immigrants | Thailand | 69.4 /100 | #153 | Good 1.2% |