Immigrants from Sudan vs Immigrants from Micronesia Disability Age Under 5

COMPARE

Immigrants from Sudan
Race
Ancestry
AfghanAfricanAlaska NativeAlaskan AthabascanAlbanianAleutAlsatianAmericanApacheArabArapahoArgentineanArmenianAssyrian/Chaldean/SyriacAustralianAustrianBahamianBangladeshiBarbadianBasqueBelgianBelizeanBermudanBhutaneseBlackfeetBolivianBrazilianBritishBritish West IndianBulgarianBurmeseCajunCambodianCanadianCape VerdeanCarpatho RusynCelticCentral AmericanCentral American IndianCherokeeCheyenneChickasawChileanChineseChippewaChoctawColombianColvilleComancheCosta RicanCreeCreekCroatianCrowCubanCypriotCzechCzechoslovakianDanishDelawareDominicanDutchDutch West IndianEastern EuropeanEcuadorianEgyptianEnglishEstonianEthiopianEuropeanFijianFilipinoFinnishFrenchFrench American IndianFrench CanadianGermanGerman RussianGhanaianGreekGuamanian/ChamorroGuatemalanGuyaneseHaitianHmongHonduranHopiHoumaHungarianIcelanderIndian (Asian)IndonesianInupiatIranianIraqiIrishIroquoisIsraeliItalianJamaicanJapaneseJordanianKenyanKiowaKoreanLaotianLatvianLebaneseLiberianLithuanianLumbeeLuxembourgerMacedonianMalaysianMalteseMarshalleseMenomineeMexicanMexican American IndianMongolianMoroccanNative HawaiianNavajoNepaleseNew ZealanderNicaraguanNigerianNorthern EuropeanNorwegianOkinawanOsageOttawaPaiutePakistaniPalestinianPanamanianParaguayanPennsylvania GermanPeruvianPimaPolishPortuguesePotawatomiPuebloPuerto RicanPuget Sound SalishRomanianRussianSalvadoranSamoanScandinavianScotch-IrishScottishSeminoleSenegaleseSerbianShoshoneSierra LeoneanSiouxSlavicSlovakSloveneSomaliSouth AfricanSouth AmericanSouth American IndianSoviet UnionSpaniardSpanishSpanish AmericanSpanish American IndianSri LankanSubsaharan AfricanSudaneseSwedishSwissSyrianTaiwaneseThaiTlingit-HaidaTohono O'OdhamTonganTrinidadian and TobagonianTsimshianTurkishU.S. Virgin IslanderUgandanUkrainianUruguayanUteVenezuelanVietnameseWelshWest IndianYakamaYaquiYugoslavianYumanYup'ikZimbabwean
Immigration
NonimmigrantsImmigrantsAfghanistanAfricaAlbaniaArgentinaArmeniaAsiaAustraliaAustriaBahamasBangladeshBarbadosBelarusBelgiumBelizeBoliviaBosnia and HerzegovinaBrazilBulgariaBurma/MyanmarCabo VerdeCambodiaCameroonCanadaCaribbeanCentral AmericaChileChinaColombiaCongoCosta RicaCroatiaCubaCzechoslovakiaDenmarkDominicaDominican RepublicEastern AfricaEastern AsiaEastern EuropeEcuadorEgyptEl SalvadorEnglandEritreaEthiopiaEuropeFijiFranceGermanyGhanaGreeceGrenadaGuatemalaGuyanaHaitiHondurasHong KongHungaryIndiaIndonesiaIranIraqIrelandIsraelItalyJamaicaJapanJordanKazakhstanKenyaKoreaKuwaitLaosLatin AmericaLatviaLebanonLiberiaLithuaniaMalaysiaMexicoMiddle AfricaMoldovaMoroccoNepalNetherlandsNicaraguaNigeriaNorth AmericaNorth MacedoniaNorthern AfricaNorthern EuropeNorwayOceaniaPakistanPanamaPeruPhilippinesPolandPortugalRomaniaRussiaSaudi ArabiaScotlandSenegalSerbiaSierra LeoneSingaporeSomaliaSouth AfricaSouth AmericaSouth Central AsiaSouth Eastern AsiaSouthern EuropeSpainSri LankaSt. Vincent and the GrenadinesSudanSwedenSwitzerlandSyriaTaiwanThailandTrinidad and TobagoTurkeyUgandaUkraineUruguayUzbekistanVenezuelaVietnamWest IndiesWestern AfricaWestern AsiaWestern EuropeYemenZaireZimbabweAzores
Immigrants from Micronesia
Race
Ancestry
AfghanAfricanAlaska NativeAlaskan AthabascanAlbanianAleutAlsatianAmericanApacheArabArapahoArgentineanArmenianAssyrian/Chaldean/SyriacAustralianAustrianBahamianBangladeshiBarbadianBasqueBelgianBelizeanBermudanBhutaneseBlackfeetBolivianBrazilianBritishBritish West IndianBulgarianBurmeseCajunCambodianCanadianCape VerdeanCarpatho RusynCelticCentral AmericanCentral American IndianCherokeeCheyenneChickasawChileanChineseChippewaChoctawColombianColvilleComancheCosta RicanCreeCreekCroatianCrowCubanCypriotCzechCzechoslovakianDanishDelawareDominicanDutchDutch West IndianEastern EuropeanEcuadorianEgyptianEnglishEstonianEthiopianEuropeanFijianFilipinoFinnishFrenchFrench American IndianFrench CanadianGermanGerman RussianGhanaianGreekGuamanian/ChamorroGuatemalanGuyaneseHaitianHmongHonduranHopiHoumaHungarianIcelanderIndian (Asian)IndonesianInupiatIranianIraqiIrishIroquoisIsraeliItalianJamaicanJapaneseJordanianKenyanKiowaKoreanLaotianLatvianLebaneseLiberianLithuanianLumbeeLuxembourgerMacedonianMalaysianMalteseMarshalleseMenomineeMexicanMexican American IndianMongolianMoroccanNative HawaiianNavajoNepaleseNew ZealanderNicaraguanNigerianNorthern EuropeanNorwegianOkinawanOsageOttawaPaiutePakistaniPalestinianPanamanianParaguayanPennsylvania GermanPeruvianPimaPolishPortuguesePotawatomiPuebloPuerto RicanPuget Sound SalishRomanianRussianSalvadoranSamoanScandinavianScotch-IrishScottishSeminoleSenegaleseSerbianShoshoneSierra LeoneanSiouxSlavicSlovakSloveneSomaliSouth AfricanSouth AmericanSouth American IndianSoviet UnionSpaniardSpanishSpanish AmericanSpanish American IndianSri LankanSubsaharan AfricanSudaneseSwedishSwissSyrianTaiwaneseThaiTlingit-HaidaTohono O'OdhamTonganTrinidadian and TobagonianTsimshianTurkishU.S. Virgin IslanderUgandanUkrainianUruguayanUteVenezuelanVietnameseWelshWest IndianYakamaYaquiYugoslavianYumanYup'ikZimbabwean
Immigration
NonimmigrantsImmigrantsAfghanistanAfricaAlbaniaArgentinaArmeniaAsiaAustraliaAustriaBahamasBangladeshBarbadosBelarusBelgiumBelizeBoliviaBosnia and HerzegovinaBrazilBulgariaBurma/MyanmarCabo VerdeCambodiaCameroonCanadaCaribbeanCentral AmericaChileChinaColombiaCongoCosta RicaCroatiaCubaCzechoslovakiaDenmarkDominicaDominican RepublicEastern AfricaEastern AsiaEastern EuropeEcuadorEgyptEl SalvadorEnglandEritreaEthiopiaEuropeFijiFranceGermanyGhanaGreeceGrenadaGuatemalaGuyanaHaitiHondurasHong KongHungaryIndiaIndonesiaIranIraqIrelandIsraelItalyJamaicaJapanJordanKazakhstanKenyaKoreaKuwaitLaosLatin AmericaLatviaLebanonLiberiaLithuaniaMalaysiaMexicoMicronesiaMiddle AfricaMoldovaMoroccoNepalNetherlandsNicaraguaNigeriaNorth AmericaNorth MacedoniaNorthern AfricaNorthern EuropeNorwayOceaniaPakistanPanamaPeruPhilippinesPolandPortugalRomaniaRussiaSaudi ArabiaScotlandSenegalSerbiaSierra LeoneSingaporeSomaliaSouth AfricaSouth AmericaSouth Central AsiaSouth Eastern AsiaSouthern EuropeSpainSri LankaSt. Vincent and the GrenadinesSwedenSwitzerlandSyriaTaiwanThailandTrinidad and TobagoTurkeyUgandaUkraineUruguayUzbekistanVenezuelaVietnamWest IndiesWestern AfricaWestern AsiaWestern EuropeYemenZaireZimbabweAzores
Disability Age Under 5
Income
Poverty
Unemployment
Labor Participation
Family Structure
Vehicle Availability
Education Level
Disability

Disability Age Under 5 Comparison

Immigrants from Sudan

Immigrants from Micronesia

Poor
Exceptional
1.3%
DISABILITY AGE UNDER 5
18.7/ 100
METRIC RATING
213th/ 347
METRIC RANK
1.0%
DISABILITY AGE UNDER 5
100.0/ 100
METRIC RATING
25th/ 347
METRIC RANK

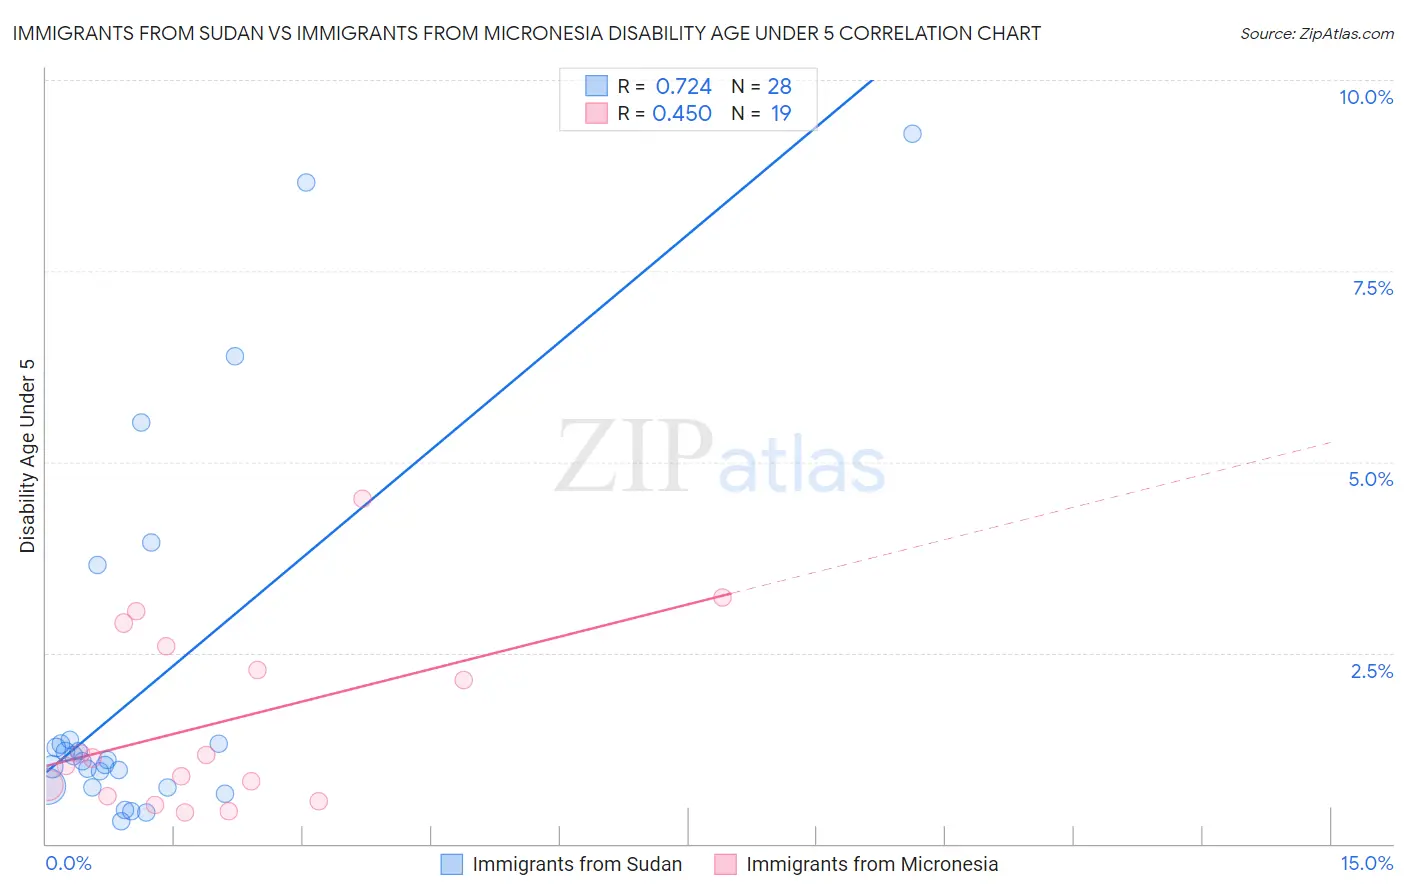
Immigrants from Sudan vs Immigrants from Micronesia Disability Age Under 5 Correlation Chart

The statistical analysis conducted on geographies consisting of 92,125,670 people shows a strong positive correlation between the proportion of Immigrants from Sudan and percentage of population with a disability under the age of 5 in the United States with a correlation coefficient (R) of 0.724 and weighted average of 1.3%. Similarly, the statistical analysis conducted on geographies consisting of 52,170,581 people shows a moderate positive correlation between the proportion of Immigrants from Micronesia and percentage of population with a disability under the age of 5 in the United States with a correlation coefficient (R) of 0.450 and weighted average of 1.0%, a difference of 27.5%.
Immigrants from Sudan vs Immigrants from Micronesia Disability Age Under 5

Disability Age Under 5 Correlation Summary

MeasurementImmigrants from SudanImmigrants from Micronesia
Minimum0.29%0.42%
Maximum9.3%4.5%
Range9.0%4.1%
Mean2.1%1.6%
Median1.1%1.1%
Interquartile 25% (IQ1)0.74%0.63%
Interquartile 75% (IQ3)1.3%2.6%
Interquartile Range (IQR)0.60%2.0%
Standard Deviation (Sample)2.5%1.2%
Standard Deviation (Population)2.4%1.2%

Similar Demographics by Disability Age Under 5

Demographics Similar to Immigrants from Sudan by Disability Age Under 5

In terms of disability age under 5, the demographic groups most similar to Immigrants from Sudan are Chilean (1.3%, a difference of 0.010%), Immigrants from Greece (1.3%, a difference of 0.060%), Pakistani (1.3%, a difference of 0.10%), Bulgarian (1.3%, a difference of 0.11%), and Immigrants from Chile (1.3%, a difference of 0.23%).
DemographicsRating | RankDisability Age Under 5
Immigrants | Poland
22.4
/100
|
#206
Fair
1.3%
Nigerians
21.2
/100
|
#207
Fair
1.3%
Mexicans
20.8
/100
|
#208
Fair
1.3%
Bulgarians
19.5
/100
|
#209
Poor
1.3%
Pakistanis
19.4
/100
|
#210
Poor
1.3%
Immigrants | Greece
19.1
/100
|
#211
Poor
1.3%
Chileans
18.8
/100
|
#212
Poor
1.3%
Immigrants | Sudan
18.7
/100
|
#213
Poor
1.3%
Immigrants | Chile
17.2
/100
|
#214
Poor
1.3%
Syrians
16.1
/100
|
#215
Poor
1.3%
Bangladeshis
15.5
/100
|
#216
Poor
1.3%
Cypriots
14.9
/100
|
#217
Poor
1.3%
Malaysians
13.2
/100
|
#218
Poor
1.3%
Immigrants | Croatia
11.2
/100
|
#219
Poor
1.3%
Serbians
9.6
/100
|
#220
Tragic
1.3%

Demographics Similar to Immigrants from Micronesia by Disability Age Under 5

In terms of disability age under 5, the demographic groups most similar to Immigrants from Micronesia are Immigrants from Taiwan (1.0%, a difference of 0.12%), Indian (Asian) (1.0%, a difference of 0.31%), Yakama (1.00%, a difference of 0.59%), Immigrants from Iran (1.00%, a difference of 0.67%), and Guyanese (1.0%, a difference of 0.97%).
DemographicsRating | RankDisability Age Under 5
Immigrants | Barbados
100.0
/100
|
#18
Exceptional
0.97%
Puget Sound Salish
100.0
/100
|
#19
Exceptional
0.97%
Nepalese
100.0
/100
|
#20
Exceptional
0.97%
British West Indians
100.0
/100
|
#21
Exceptional
0.99%
Immigrants | Iran
100.0
/100
|
#22
Exceptional
1.00%
Yakama
100.0
/100
|
#23
Exceptional
1.00%
Indians (Asian)
100.0
/100
|
#24
Exceptional
1.0%
Immigrants | Micronesia
100.0
/100
|
#25
Exceptional
1.0%
Immigrants | Taiwan
100.0
/100
|
#26
Exceptional
1.0%
Guyanese
100.0
/100
|
#27
Exceptional
1.0%
Immigrants | Eastern Asia
100.0
/100
|
#28
Exceptional
1.0%
Immigrants | Belarus
100.0
/100
|
#29
Exceptional
1.0%
Immigrants | South Central Asia
99.9
/100
|
#30
Exceptional
1.0%
Armenians
99.9
/100
|
#31
Exceptional
1.0%
Iranians
99.9
/100
|
#32
Exceptional
1.0%