Immigrants from Austria vs Iraqi Disability Age Under 5

COMPARE

Immigrants from Austria
Race
Ancestry
AfghanAfricanAlaska NativeAlaskan AthabascanAlbanianAleutAlsatianAmericanApacheArabArapahoArgentineanArmenianAssyrian/Chaldean/SyriacAustralianAustrianBahamianBangladeshiBarbadianBasqueBelgianBelizeanBermudanBhutaneseBlackfeetBolivianBrazilianBritishBritish West IndianBulgarianBurmeseCajunCambodianCanadianCape VerdeanCarpatho RusynCelticCentral AmericanCentral American IndianCherokeeCheyenneChickasawChileanChineseChippewaChoctawColombianColvilleComancheCosta RicanCreeCreekCroatianCrowCubanCypriotCzechCzechoslovakianDanishDelawareDominicanDutchDutch West IndianEastern EuropeanEcuadorianEgyptianEnglishEstonianEthiopianEuropeanFijianFilipinoFinnishFrenchFrench American IndianFrench CanadianGermanGerman RussianGhanaianGreekGuamanian/ChamorroGuatemalanGuyaneseHaitianHmongHonduranHopiHoumaHungarianIcelanderIndian (Asian)IndonesianInupiatIranianIrishIroquoisIsraeliItalianJamaicanJapaneseJordanianKenyanKiowaKoreanLaotianLatvianLebaneseLiberianLithuanianLumbeeLuxembourgerMacedonianMalaysianMalteseMarshalleseMenomineeMexicanMexican American IndianMongolianMoroccanNative HawaiianNavajoNepaleseNew ZealanderNicaraguanNigerianNorthern EuropeanNorwegianOkinawanOsageOttawaPaiutePakistaniPalestinianPanamanianParaguayanPennsylvania GermanPeruvianPimaPolishPortuguesePotawatomiPuebloPuerto RicanPuget Sound SalishRomanianRussianSalvadoranSamoanScandinavianScotch-IrishScottishSeminoleSenegaleseSerbianShoshoneSierra LeoneanSiouxSlavicSlovakSloveneSomaliSouth AfricanSouth AmericanSouth American IndianSoviet UnionSpaniardSpanishSpanish AmericanSpanish American IndianSri LankanSubsaharan AfricanSudaneseSwedishSwissSyrianTaiwaneseThaiTlingit-HaidaTohono O'OdhamTonganTrinidadian and TobagonianTsimshianTurkishU.S. Virgin IslanderUgandanUkrainianUruguayanUteVenezuelanVietnameseWelshWest IndianYakamaYaquiYugoslavianYumanYup'ikZimbabwean
Immigration
NonimmigrantsImmigrantsAfghanistanAfricaAlbaniaArgentinaArmeniaAsiaAustraliaAustriaBahamasBangladeshBarbadosBelarusBelgiumBelizeBoliviaBosnia and HerzegovinaBrazilBulgariaBurma/MyanmarCabo VerdeCambodiaCameroonCanadaCaribbeanCentral AmericaChileChinaColombiaCongoCosta RicaCroatiaCubaCzechoslovakiaDenmarkDominicaDominican RepublicEastern AfricaEastern AsiaEastern EuropeEcuadorEgyptEl SalvadorEnglandEritreaEthiopiaEuropeFijiFranceGermanyGhanaGreeceGrenadaGuatemalaGuyanaHaitiHondurasHong KongHungaryIndiaIndonesiaIranIraqIrelandIsraelItalyJamaicaJapanJordanKazakhstanKenyaKoreaKuwaitLaosLatin AmericaLatviaLebanonLiberiaLithuaniaMalaysiaMexicoMicronesiaMiddle AfricaMoldovaMoroccoNepalNetherlandsNicaraguaNigeriaNorth AmericaNorth MacedoniaNorthern AfricaNorthern EuropeNorwayOceaniaPakistanPanamaPeruPhilippinesPolandPortugalRomaniaRussiaSaudi ArabiaScotlandSenegalSerbiaSierra LeoneSingaporeSomaliaSouth AfricaSouth AmericaSouth Central AsiaSouth Eastern AsiaSouthern EuropeSpainSri LankaSt. Vincent and the GrenadinesSudanSwedenSwitzerlandSyriaTaiwanThailandTrinidad and TobagoTurkeyUgandaUkraineUruguayUzbekistanVenezuelaVietnamWest IndiesWestern AfricaWestern AsiaWestern EuropeYemenZaireZimbabweAzores
Iraqi
Race
Ancestry
AfghanAfricanAlaska NativeAlaskan AthabascanAlbanianAleutAlsatianAmericanApacheArabArapahoArgentineanArmenianAssyrian/Chaldean/SyriacAustralianAustrianBahamianBangladeshiBarbadianBasqueBelgianBelizeanBermudanBhutaneseBlackfeetBolivianBrazilianBritishBritish West IndianBulgarianBurmeseCajunCambodianCanadianCape VerdeanCarpatho RusynCelticCentral AmericanCentral American IndianCherokeeCheyenneChickasawChileanChineseChippewaChoctawColombianColvilleComancheCosta RicanCreeCreekCroatianCrowCubanCypriotCzechCzechoslovakianDanishDelawareDominicanDutchDutch West IndianEastern EuropeanEcuadorianEgyptianEnglishEstonianEthiopianEuropeanFijianFilipinoFinnishFrenchFrench American IndianFrench CanadianGermanGerman RussianGhanaianGreekGuamanian/ChamorroGuatemalanGuyaneseHaitianHmongHonduranHopiHoumaHungarianIcelanderIndian (Asian)IndonesianInupiatIranianIraqiIrishIroquoisIsraeliItalianJamaicanJapaneseJordanianKenyanKiowaKoreanLaotianLatvianLebaneseLiberianLithuanianLumbeeLuxembourgerMacedonianMalaysianMalteseMarshalleseMenomineeMexicanMexican American IndianMongolianMoroccanNative HawaiianNavajoNepaleseNew ZealanderNicaraguanNigerianNorthern EuropeanNorwegianOkinawanOsageOttawaPaiutePakistaniPalestinianPanamanianParaguayanPennsylvania GermanPeruvianPimaPolishPortuguesePotawatomiPuebloPuerto RicanPuget Sound SalishRomanianRussianSalvadoranSamoanScandinavianScotch-IrishScottishSeminoleSenegaleseSerbianShoshoneSierra LeoneanSiouxSlavicSlovakSloveneSomaliSouth AfricanSouth AmericanSouth American IndianSoviet UnionSpaniardSpanishSpanish AmericanSpanish American IndianSri LankanSubsaharan AfricanSudaneseSwedishSwissSyrianTaiwaneseThaiTlingit-HaidaTohono O'OdhamTonganTrinidadian and TobagonianTsimshianTurkishU.S. Virgin IslanderUgandanUkrainianUruguayanUteVenezuelanVietnameseWelshWest IndianYakamaYaquiYugoslavianYumanYup'ikZimbabwean
Immigration
NonimmigrantsImmigrantsAfghanistanAfricaAlbaniaArgentinaArmeniaAsiaAustraliaBahamasBangladeshBarbadosBelarusBelgiumBelizeBoliviaBosnia and HerzegovinaBrazilBulgariaBurma/MyanmarCabo VerdeCambodiaCameroonCanadaCaribbeanCentral AmericaChileChinaColombiaCongoCosta RicaCroatiaCubaCzechoslovakiaDenmarkDominicaDominican RepublicEastern AfricaEastern AsiaEastern EuropeEcuadorEgyptEl SalvadorEnglandEritreaEthiopiaEuropeFijiFranceGermanyGhanaGreeceGrenadaGuatemalaGuyanaHaitiHondurasHong KongHungaryIndiaIndonesiaIranIraqIrelandIsraelItalyJamaicaJapanJordanKazakhstanKenyaKoreaKuwaitLaosLatin AmericaLatviaLebanonLiberiaLithuaniaMalaysiaMexicoMicronesiaMiddle AfricaMoldovaMoroccoNepalNetherlandsNicaraguaNigeriaNorth AmericaNorth MacedoniaNorthern AfricaNorthern EuropeNorwayOceaniaPakistanPanamaPeruPhilippinesPolandPortugalRomaniaRussiaSaudi ArabiaScotlandSenegalSerbiaSierra LeoneSingaporeSomaliaSouth AfricaSouth AmericaSouth Central AsiaSouth Eastern AsiaSouthern EuropeSpainSri LankaSt. Vincent and the GrenadinesSudanSwedenSwitzerlandSyriaTaiwanThailandTrinidad and TobagoTurkeyUgandaUkraineUruguayUzbekistanVenezuelaVietnamWest IndiesWestern AfricaWestern AsiaWestern EuropeYemenZaireZimbabweAzores
Disability Age Under 5
Income
Poverty
Unemployment
Labor Participation
Family Structure
Vehicle Availability
Education Level
Disability

Disability Age Under 5 Comparison

Immigrants from Austria

Iraqis

Tragic
Exceptional
1.3%
DISABILITY AGE UNDER 5
2.3/ 100
METRIC RATING
239th/ 347
METRIC RANK
1.2%
DISABILITY AGE UNDER 5
95.1/ 100
METRIC RATING
108th/ 347
METRIC RANK

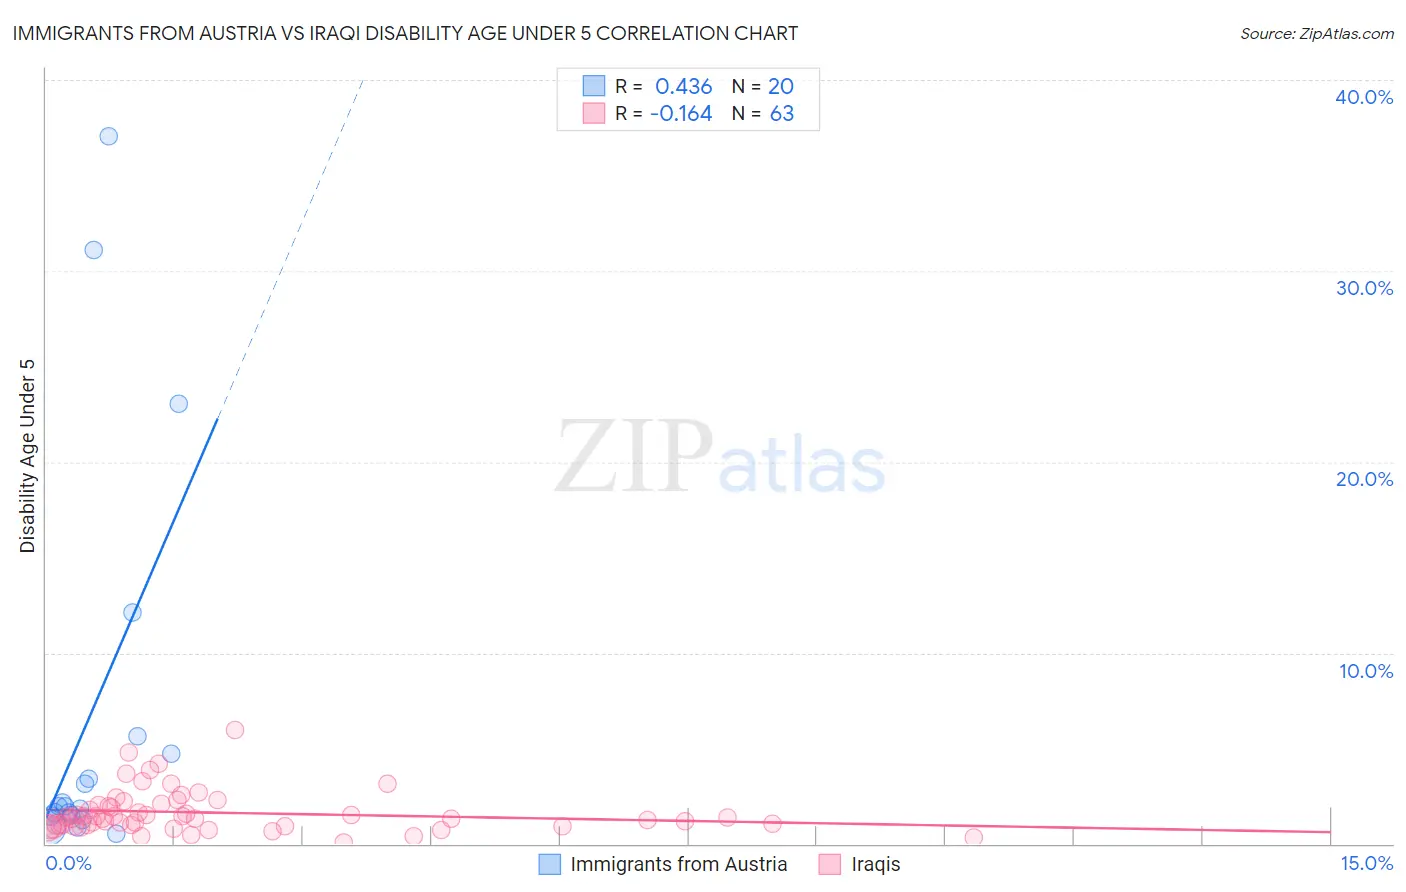
Immigrants from Austria vs Iraqi Disability Age Under 5 Correlation Chart

The statistical analysis conducted on geographies consisting of 111,174,092 people shows a moderate positive correlation between the proportion of Immigrants from Austria and percentage of population with a disability under the age of 5 in the United States with a correlation coefficient (R) of 0.436 and weighted average of 1.3%. Similarly, the statistical analysis conducted on geographies consisting of 119,151,918 people shows a poor negative correlation between the proportion of Iraqis and percentage of population with a disability under the age of 5 in the United States with a correlation coefficient (R) of -0.164 and weighted average of 1.2%, a difference of 16.3%.
Immigrants from Austria vs Iraqi Disability Age Under 5

Disability Age Under 5 Correlation Summary

MeasurementImmigrants from AustriaIraqi
Minimum0.55%0.070%
Maximum37.0%5.9%
Range36.5%5.9%
Mean6.9%1.6%
Median2.0%1.3%
Interquartile 25% (IQ1)1.5%0.92%
Interquartile 75% (IQ3)5.2%2.0%
Interquartile Range (IQR)3.7%1.1%
Standard Deviation (Sample)10.7%1.1%
Standard Deviation (Population)10.4%1.1%

Similar Demographics by Disability Age Under 5

Demographics Similar to Immigrants from Austria by Disability Age Under 5

In terms of disability age under 5, the demographic groups most similar to Immigrants from Austria are Native Hawaiian (1.3%, a difference of 0.020%), Maltese (1.3%, a difference of 0.090%), Spanish American Indian (1.3%, a difference of 0.16%), Lumbee (1.3%, a difference of 0.18%), and Immigrants from Cameroon (1.4%, a difference of 0.56%).
DemographicsRating | RankDisability Age Under 5
French American Indians
4.5
/100
|
#232
Tragic
1.3%
Tongans
4.2
/100
|
#233
Tragic
1.3%
Pueblo
3.8
/100
|
#234
Tragic
1.3%
Central American Indians
3.6
/100
|
#235
Tragic
1.3%
South American Indians
3.3
/100
|
#236
Tragic
1.3%
Basques
3.0
/100
|
#237
Tragic
1.3%
Spanish American Indians
2.4
/100
|
#238
Tragic
1.3%
Immigrants | Austria
2.3
/100
|
#239
Tragic
1.3%
Native Hawaiians
2.2
/100
|
#240
Tragic
1.3%
Maltese
2.2
/100
|
#241
Tragic
1.3%
Lumbee
2.1
/100
|
#242
Tragic
1.3%
Immigrants | Cameroon
1.7
/100
|
#243
Tragic
1.4%
Spaniards
1.4
/100
|
#244
Tragic
1.4%
Potawatomi
1.1
/100
|
#245
Tragic
1.4%
Russians
1.0
/100
|
#246
Tragic
1.4%

Demographics Similar to Iraqis by Disability Age Under 5

In terms of disability age under 5, the demographic groups most similar to Iraqis are Immigrants from Panama (1.2%, a difference of 0.020%), Immigrants from Lebanon (1.2%, a difference of 0.040%), Immigrants from West Indies (1.2%, a difference of 0.13%), Cambodian (1.2%, a difference of 0.17%), and Senegalese (1.2%, a difference of 0.24%).
DemographicsRating | RankDisability Age Under 5
Immigrants | Uganda
96.1
/100
|
#101
Exceptional
1.1%
Immigrants | Morocco
96.0
/100
|
#102
Exceptional
1.2%
Immigrants | Nicaragua
96.0
/100
|
#103
Exceptional
1.2%
Indonesians
95.9
/100
|
#104
Exceptional
1.2%
Immigrants | South Africa
95.6
/100
|
#105
Exceptional
1.2%
Cambodians
95.4
/100
|
#106
Exceptional
1.2%
Immigrants | West Indies
95.3
/100
|
#107
Exceptional
1.2%
Iraqis
95.1
/100
|
#108
Exceptional
1.2%
Immigrants | Panama
95.0
/100
|
#109
Exceptional
1.2%
Immigrants | Lebanon
95.0
/100
|
#110
Exceptional
1.2%
Senegalese
94.6
/100
|
#111
Exceptional
1.2%
Immigrants | Australia
94.4
/100
|
#112
Exceptional
1.2%
Immigrants | Oceania
94.2
/100
|
#113
Exceptional
1.2%
Belizeans
93.9
/100
|
#114
Exceptional
1.2%
Immigrants | Caribbean
93.8
/100
|
#115
Exceptional
1.2%