Zip Codes with the Highest Percentage of Population with a Degree in Liberal Arts and History in Dover, DE
RELATED REPORTS & OPTIONS
Liberal Arts and History
Dover
Compare Zip Codes
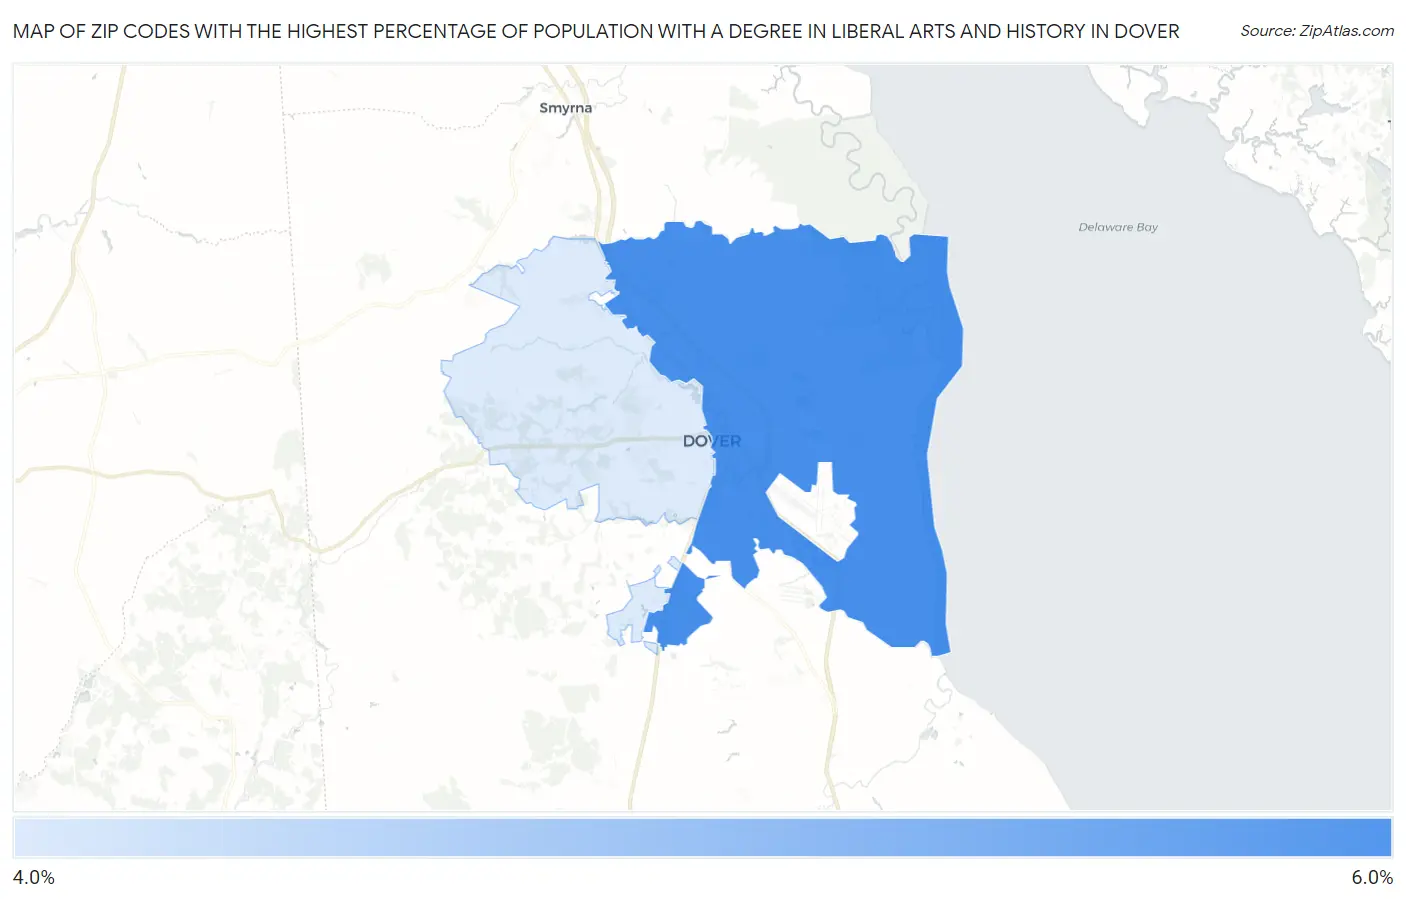
Map of Zip Codes with the Highest Percentage of Population with a Degree in Liberal Arts and History in Dover
4.2%
5.9%
Zip Codes with the Highest Percentage of Population with a Degree in Liberal Arts and History in Dover, DE
| Zip Code | % Graduates | vs State | vs National | |
| 1. | 19901 | 5.9% | 5.5%(+0.479)#25 | 4.9%(+1.06)#8,699 |
| 2. | 19904 | 4.2% | 5.5%(-1.23)#43 | 4.9%(-0.650)#13,922 |
1
Common Questions
What are the Top Zip Codes with the Highest Percentage of Population with a Degree in Liberal Arts and History in Dover, DE?
Top Zip Codes with the Highest Percentage of Population with a Degree in Liberal Arts and History in Dover, DE are:
What zip code has the Highest Percentage of Population with a Degree in Liberal Arts and History in Dover, DE?
19901 has the Highest Percentage of Population with a Degree in Liberal Arts and History in Dover, DE with 5.9%.
What is the Percentage of Population with a Degree in Liberal Arts and History in Dover, DE?
Percentage of Population with a Degree in Liberal Arts and History in Dover is 5.7%.
What is the Percentage of Population with a Degree in Liberal Arts and History in Delaware?
Percentage of Population with a Degree in Liberal Arts and History in Delaware is 5.5%.
What is the Percentage of Population with a Degree in Liberal Arts and History in the United States?
Percentage of Population with a Degree in Liberal Arts and History in the United States is 4.9%.