Zip Codes with the Highest Percentage of Population with a Degree in Liberal Arts and History in Newark, DE
RELATED REPORTS & OPTIONS
Liberal Arts and History
Newark
Compare Zip Codes
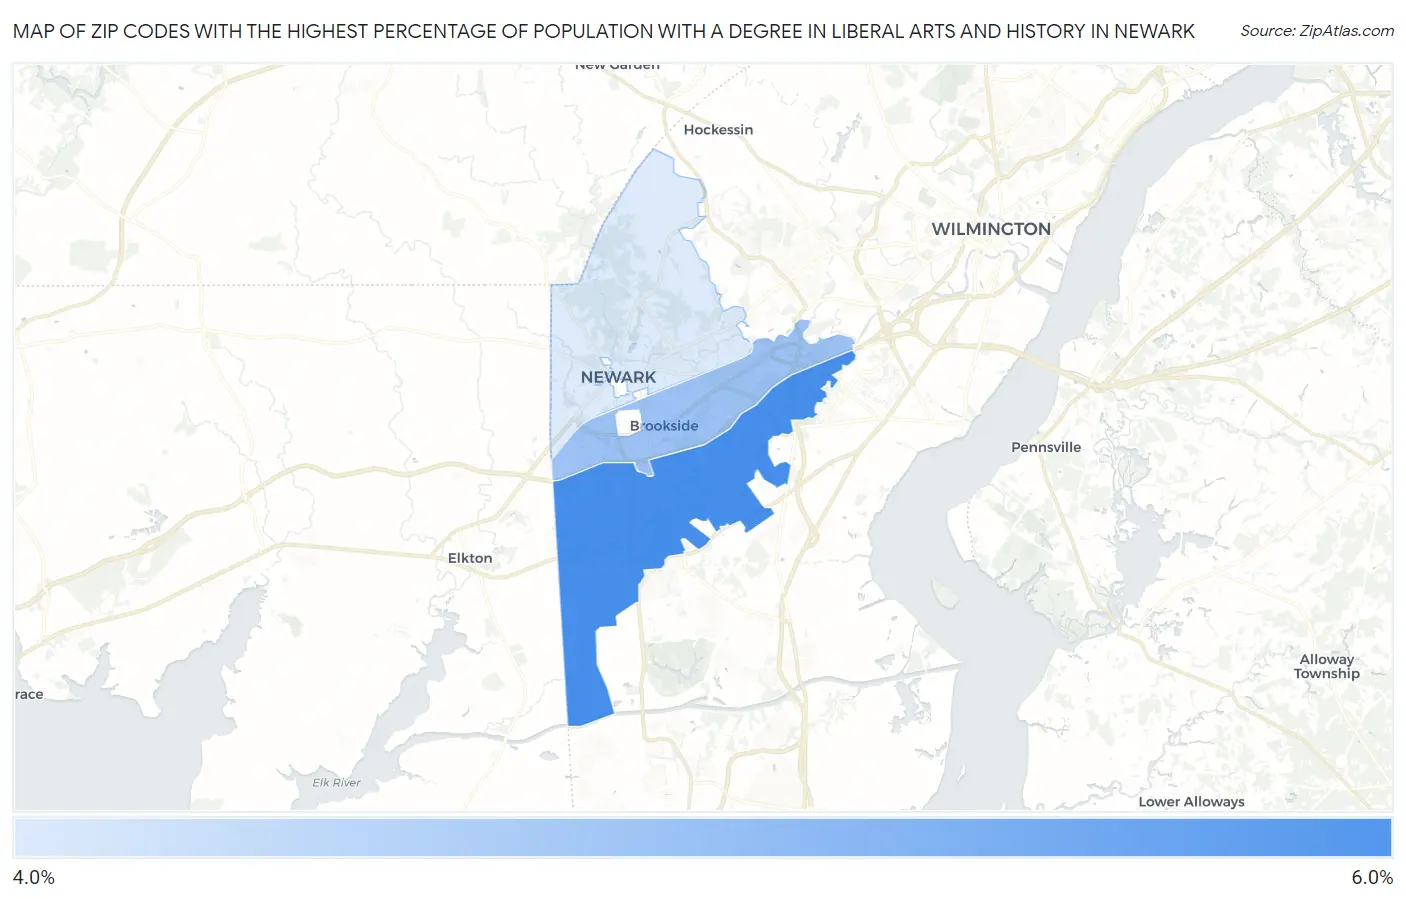
Map of Zip Codes with the Highest Percentage of Population with a Degree in Liberal Arts and History in Newark
4.9%
5.4%
Zip Codes with the Highest Percentage of Population with a Degree in Liberal Arts and History in Newark, DE
| Zip Code | % Graduates | vs State | vs National | |
| 1. | 19702 | 5.4% | 5.5%(-0.083)#30 | 4.9%(+0.496)#10,216 |
| 2. | 19713 | 5.1% | 5.5%(-0.367)#35 | 4.9%(+0.212)#11,090 |
| 3. | 19711 | 4.9% | 5.5%(-0.590)#39 | 4.9%(-0.011)#11,784 |
1
Common Questions
What are the Top Zip Codes with the Highest Percentage of Population with a Degree in Liberal Arts and History in Newark, DE?
Top Zip Codes with the Highest Percentage of Population with a Degree in Liberal Arts and History in Newark, DE are:
What zip code has the Highest Percentage of Population with a Degree in Liberal Arts and History in Newark, DE?
19702 has the Highest Percentage of Population with a Degree in Liberal Arts and History in Newark, DE with 5.4%.
What is the Percentage of Population with a Degree in Liberal Arts and History in Newark, DE?
Percentage of Population with a Degree in Liberal Arts and History in Newark is 3.5%.
What is the Percentage of Population with a Degree in Liberal Arts and History in Delaware?
Percentage of Population with a Degree in Liberal Arts and History in Delaware is 5.5%.
What is the Percentage of Population with a Degree in Liberal Arts and History in the United States?
Percentage of Population with a Degree in Liberal Arts and History in the United States is 4.9%.