Zip Codes with the Highest Percentage of Population Employed in Legal Services & Support in Newark, DE
RELATED REPORTS & OPTIONS
Legal Services & Support
Newark
Compare Zip Codes
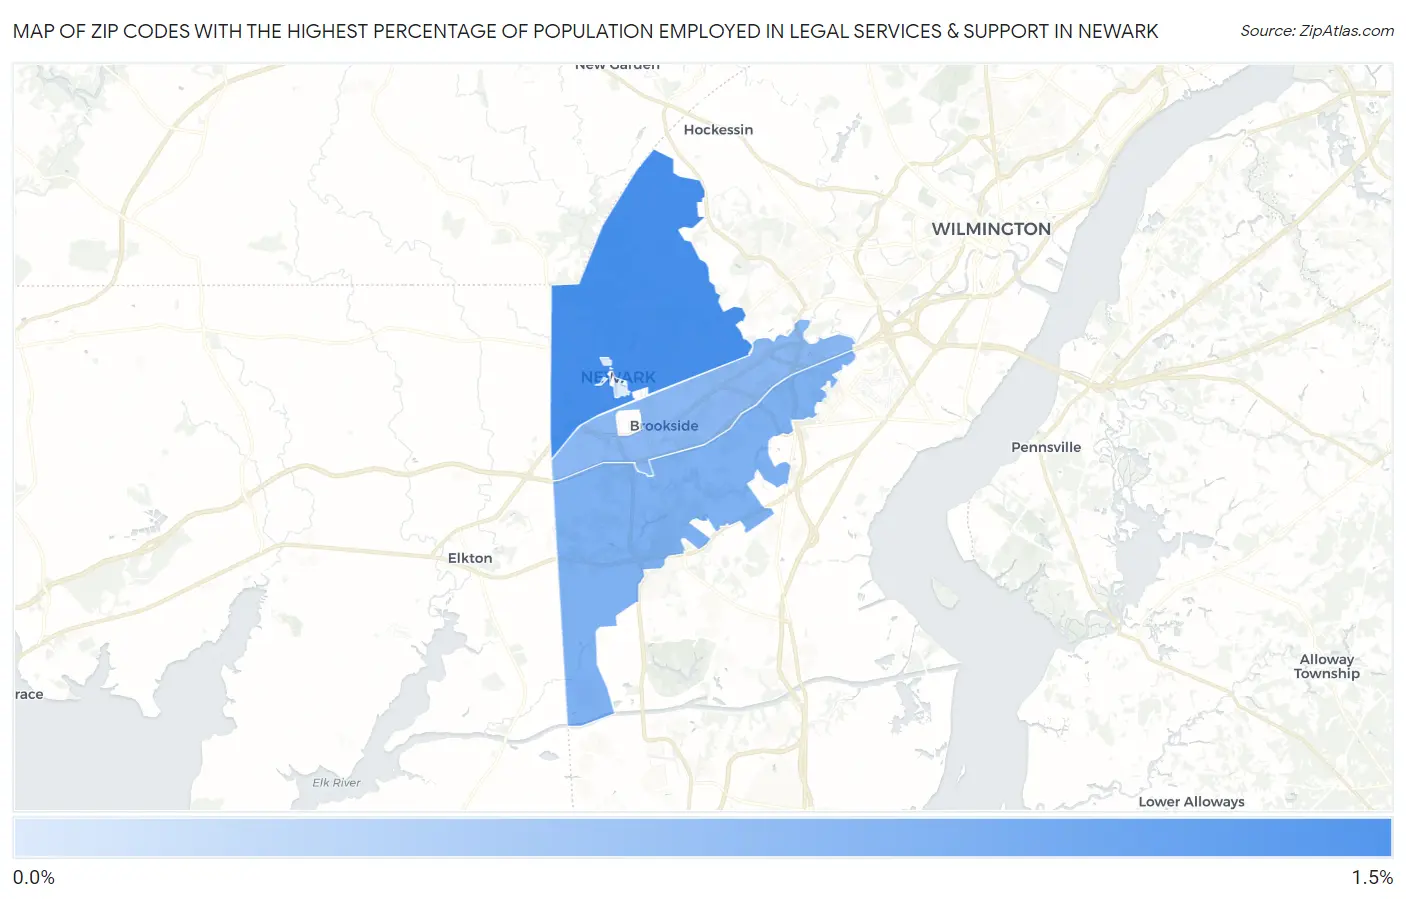
Map of Zip Codes with the Highest Percentage of Population Employed in Legal Services & Support in Newark
0.24%
1.4%
Zip Codes with the Highest Percentage of Population Employed in Legal Services & Support in Newark, DE
| Zip Code | % Employed | vs State | vs National | |
| 1. | 19711 | 1.4% | 1.4%(-0.033)#20 | 1.2%(+0.214)#5,488 |
| 2. | 19702 | 0.96% | 1.4%(-0.470)#29 | 1.2%(-0.224)#8,124 |
| 3. | 19713 | 0.88% | 1.4%(-0.547)#33 | 1.2%(-0.300)#8,751 |
| 4. | 19717 | 0.24% | 1.4%(-1.19)#47 | 1.2%(-0.947)#15,792 |
1
Common Questions
What are the Top 3 Zip Codes with the Highest Percentage of Population Employed in Legal Services & Support in Newark, DE?
Top 3 Zip Codes with the Highest Percentage of Population Employed in Legal Services & Support in Newark, DE are:
What zip code has the Highest Percentage of Population Employed in Legal Services & Support in Newark, DE?
19711 has the Highest Percentage of Population Employed in Legal Services & Support in Newark, DE with 1.4%.
What is the Percentage of Population Employed in Legal Services & Support in Newark, DE?
Percentage of Population Employed in Legal Services & Support in Newark is 1.0%.
What is the Percentage of Population Employed in Legal Services & Support in Delaware?
Percentage of Population Employed in Legal Services & Support in Delaware is 1.4%.
What is the Percentage of Population Employed in Legal Services & Support in the United States?
Percentage of Population Employed in Legal Services & Support in the United States is 1.2%.