Zip Codes with the Highest Percentage of Population Employed in Legal Services & Support in Dover, DE
RELATED REPORTS & OPTIONS
Legal Services & Support
Dover
Compare Zip Codes
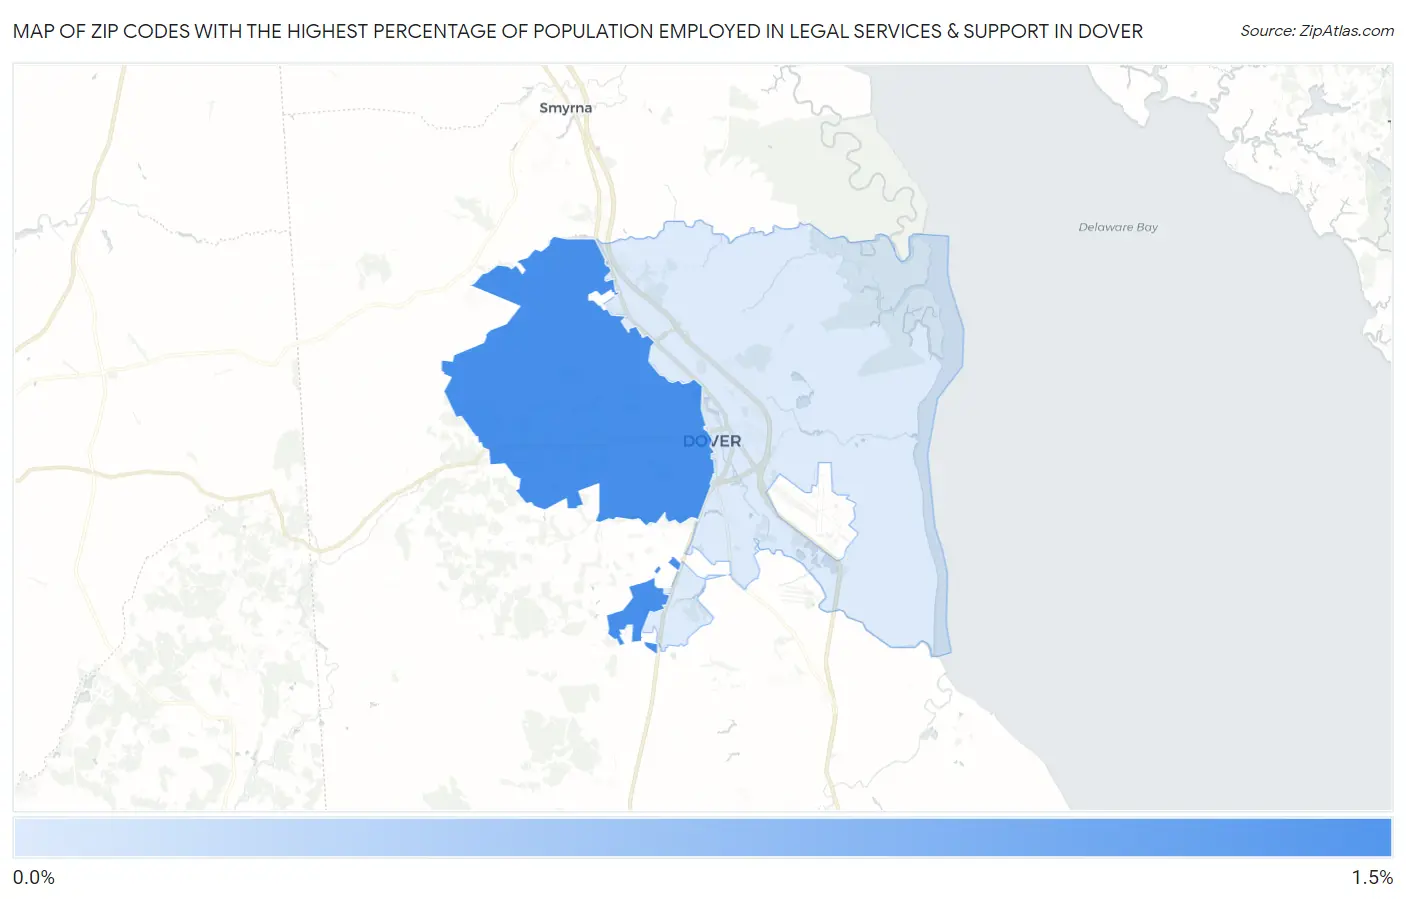
Map of Zip Codes with the Highest Percentage of Population Employed in Legal Services & Support in Dover
0.46%
1.3%
Zip Codes with the Highest Percentage of Population Employed in Legal Services & Support in Dover, DE
| Zip Code | % Employed | vs State | vs National | |
| 1. | 19904 | 1.3% | 1.4%(-0.081)#22 | 1.2%(+0.166)#5,686 |
| 2. | 19901 | 0.46% | 1.4%(-0.966)#41 | 1.2%(-0.719)#13,071 |
1
Common Questions
What are the Top Zip Codes with the Highest Percentage of Population Employed in Legal Services & Support in Dover, DE?
Top Zip Codes with the Highest Percentage of Population Employed in Legal Services & Support in Dover, DE are:
What zip code has the Highest Percentage of Population Employed in Legal Services & Support in Dover, DE?
19904 has the Highest Percentage of Population Employed in Legal Services & Support in Dover, DE with 1.3%.
What is the Percentage of Population Employed in Legal Services & Support in Dover, DE?
Percentage of Population Employed in Legal Services & Support in Dover is 1.4%.
What is the Percentage of Population Employed in Legal Services & Support in Delaware?
Percentage of Population Employed in Legal Services & Support in Delaware is 1.4%.
What is the Percentage of Population Employed in Legal Services & Support in the United States?
Percentage of Population Employed in Legal Services & Support in the United States is 1.2%.