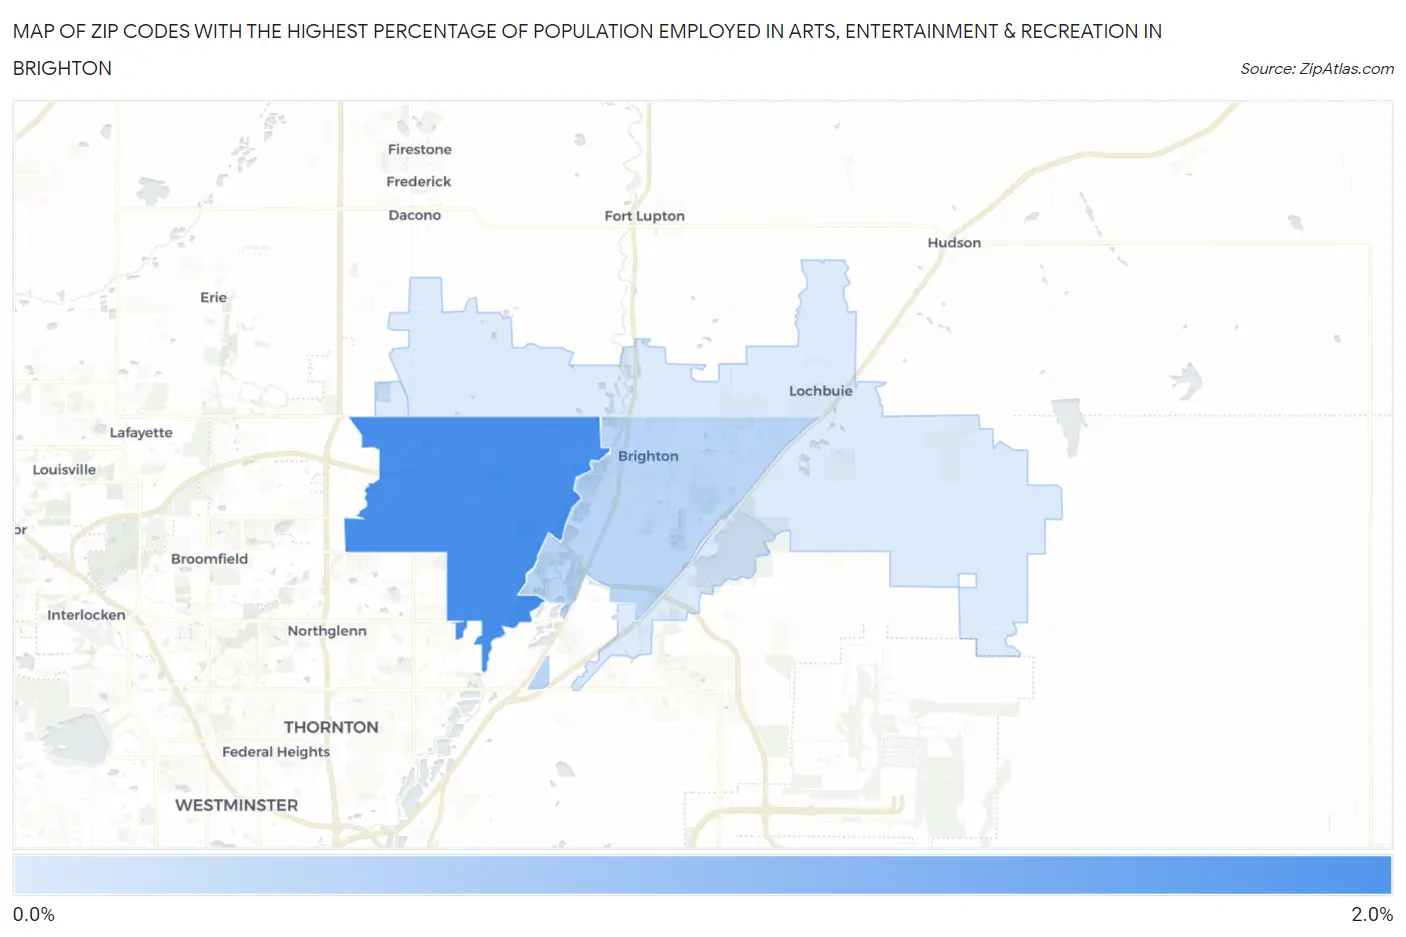
Zip Codes with the Highest Percentage of Population Employed in Arts, Entertainment & Recreation in Brighton, CO
RELATED REPORTS & OPTIONS
Arts, Entertainment & Recreation
Brighton
Compare Zip Codes
Map of Zip Codes with the Highest Percentage of Population Employed in Arts, Entertainment & Recreation in Brighton
0.90%
1.5%
Zip Codes with the Highest Percentage of Population Employed in Arts, Entertainment & Recreation in Brighton, CO
| Zip Code | % Employed | vs State | vs National | |
| 1. | 80602 | 1.5% | 2.6%(-1.03)#282 | 2.1%(-0.537)#12,905 |
| 2. | 80601 | 1.1% | 2.6%(-1.52)#319 | 2.1%(-1.03)#16,573 |
| 3. | 80603 | 0.90% | 2.6%(-1.67)#332 | 2.1%(-1.18)#17,653 |
1
Common Questions
What are the Top Zip Codes with the Highest Percentage of Population Employed in Arts, Entertainment & Recreation in Brighton, CO?
Top Zip Codes with the Highest Percentage of Population Employed in Arts, Entertainment & Recreation in Brighton, CO are:
What zip code has the Highest Percentage of Population Employed in Arts, Entertainment & Recreation in Brighton, CO?
80602 has the Highest Percentage of Population Employed in Arts, Entertainment & Recreation in Brighton, CO with 1.5%.
What is the Percentage of Population Employed in Arts, Entertainment & Recreation in Brighton, CO?
Percentage of Population Employed in Arts, Entertainment & Recreation in Brighton is 1.0%.
What is the Percentage of Population Employed in Arts, Entertainment & Recreation in Colorado?
Percentage of Population Employed in Arts, Entertainment & Recreation in Colorado is 2.6%.
What is the Percentage of Population Employed in Arts, Entertainment & Recreation in the United States?
Percentage of Population Employed in Arts, Entertainment & Recreation in the United States is 2.1%.