Zip Codes with the Highest Percentage of Population Employed in Arts, Entertainment & Recreation in Durango, CO
RELATED REPORTS & OPTIONS
Arts, Entertainment & Recreation
Durango
Compare Zip Codes
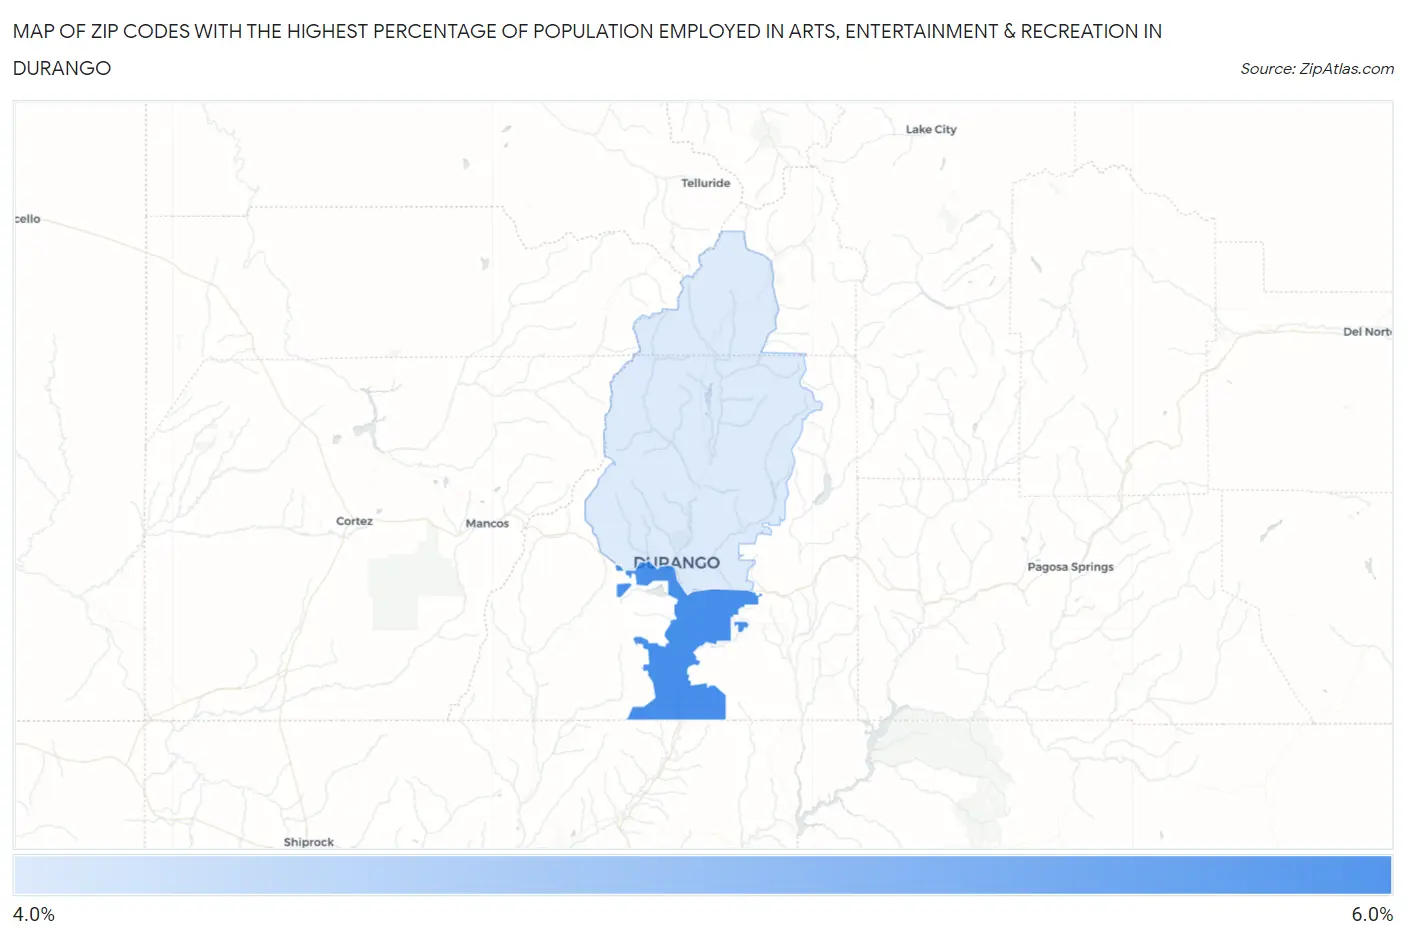
Map of Zip Codes with the Highest Percentage of Population Employed in Arts, Entertainment & Recreation in Durango
4.7%
5.0%
Zip Codes with the Highest Percentage of Population Employed in Arts, Entertainment & Recreation in Durango, CO
| Zip Code | % Employed | vs State | vs National | |
| 1. | 81303 | 5.0% | 2.6%(+2.44)#68 | 2.1%(+2.93)#2,277 |
| 2. | 81301 | 4.7% | 2.6%(+2.14)#76 | 2.1%(+2.63)#2,520 |
1
Common Questions
What are the Top Zip Codes with the Highest Percentage of Population Employed in Arts, Entertainment & Recreation in Durango, CO?
Top Zip Codes with the Highest Percentage of Population Employed in Arts, Entertainment & Recreation in Durango, CO are:
What zip code has the Highest Percentage of Population Employed in Arts, Entertainment & Recreation in Durango, CO?
81303 has the Highest Percentage of Population Employed in Arts, Entertainment & Recreation in Durango, CO with 5.0%.
What is the Percentage of Population Employed in Arts, Entertainment & Recreation in Durango, CO?
Percentage of Population Employed in Arts, Entertainment & Recreation in Durango is 5.1%.
What is the Percentage of Population Employed in Arts, Entertainment & Recreation in Colorado?
Percentage of Population Employed in Arts, Entertainment & Recreation in Colorado is 2.6%.
What is the Percentage of Population Employed in Arts, Entertainment & Recreation in the United States?
Percentage of Population Employed in Arts, Entertainment & Recreation in the United States is 2.1%.