Zip Codes with the Highest Percentage of Population Employed in Accommodation & Food Services in Boulder, CO
RELATED REPORTS & OPTIONS
Accommodation & Food Services
Boulder
Compare Zip Codes
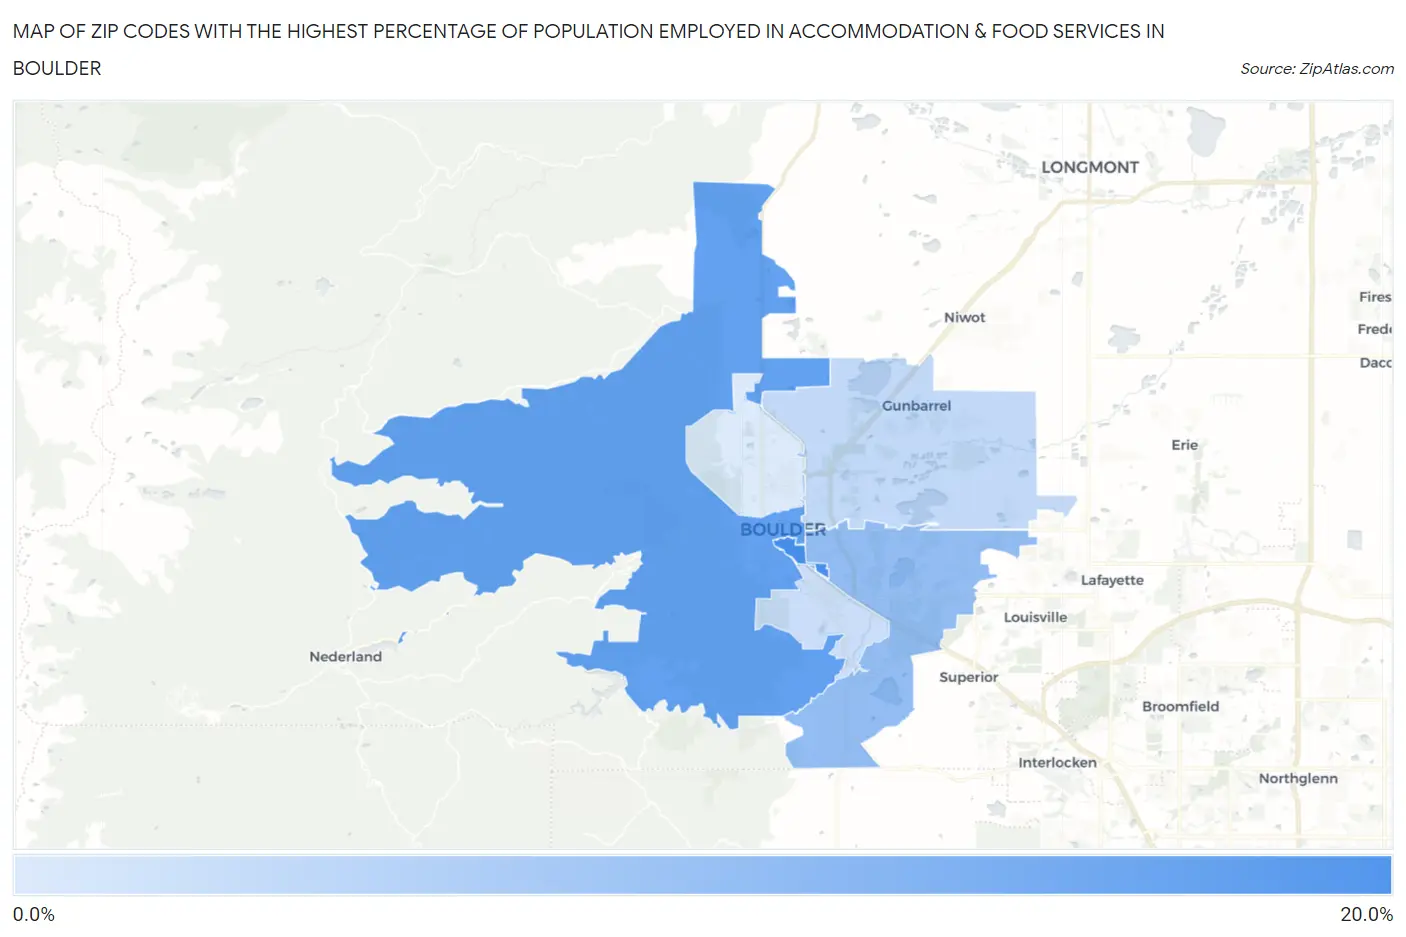
Map of Zip Codes with the Highest Percentage of Population Employed in Accommodation & Food Services in Boulder
5.3%
16.8%
Zip Codes with the Highest Percentage of Population Employed in Accommodation & Food Services in Boulder, CO
| Zip Code | % Employed | vs State | vs National | |
| 1. | 80310 | 16.8% | 6.9%(+9.93)#22 | 6.9%(+9.95)#1,292 |
| 2. | 80302 | 14.5% | 6.9%(+7.61)#34 | 6.9%(+7.63)#1,814 |
| 3. | 80303 | 10.8% | 6.9%(+3.93)#80 | 6.9%(+3.95)#3,696 |
| 4. | 80301 | 7.3% | 6.9%(+0.369)#163 | 6.9%(+0.389)#9,617 |
| 5. | 80305 | 6.7% | 6.9%(-0.221)#190 | 6.9%(-0.201)#11,254 |
| 6. | 80304 | 5.3% | 6.9%(-1.64)#261 | 6.9%(-1.62)#15,917 |
1
Common Questions
What are the Top 5 Zip Codes with the Highest Percentage of Population Employed in Accommodation & Food Services in Boulder, CO?
Top 5 Zip Codes with the Highest Percentage of Population Employed in Accommodation & Food Services in Boulder, CO are:
What zip code has the Highest Percentage of Population Employed in Accommodation & Food Services in Boulder, CO?
80310 has the Highest Percentage of Population Employed in Accommodation & Food Services in Boulder, CO with 16.8%.
What is the Percentage of Population Employed in Accommodation & Food Services in Boulder, CO?
Percentage of Population Employed in Accommodation & Food Services in Boulder is 10.6%.
What is the Percentage of Population Employed in Accommodation & Food Services in Colorado?
Percentage of Population Employed in Accommodation & Food Services in Colorado is 6.9%.
What is the Percentage of Population Employed in Accommodation & Food Services in the United States?
Percentage of Population Employed in Accommodation & Food Services in the United States is 6.9%.