Zip Codes with the Highest Percentage of Population Employed in Accommodation & Food Services in Colorado Springs, CO
RELATED REPORTS & OPTIONS
Accommodation & Food Services
Colorado Springs
Compare Zip Codes
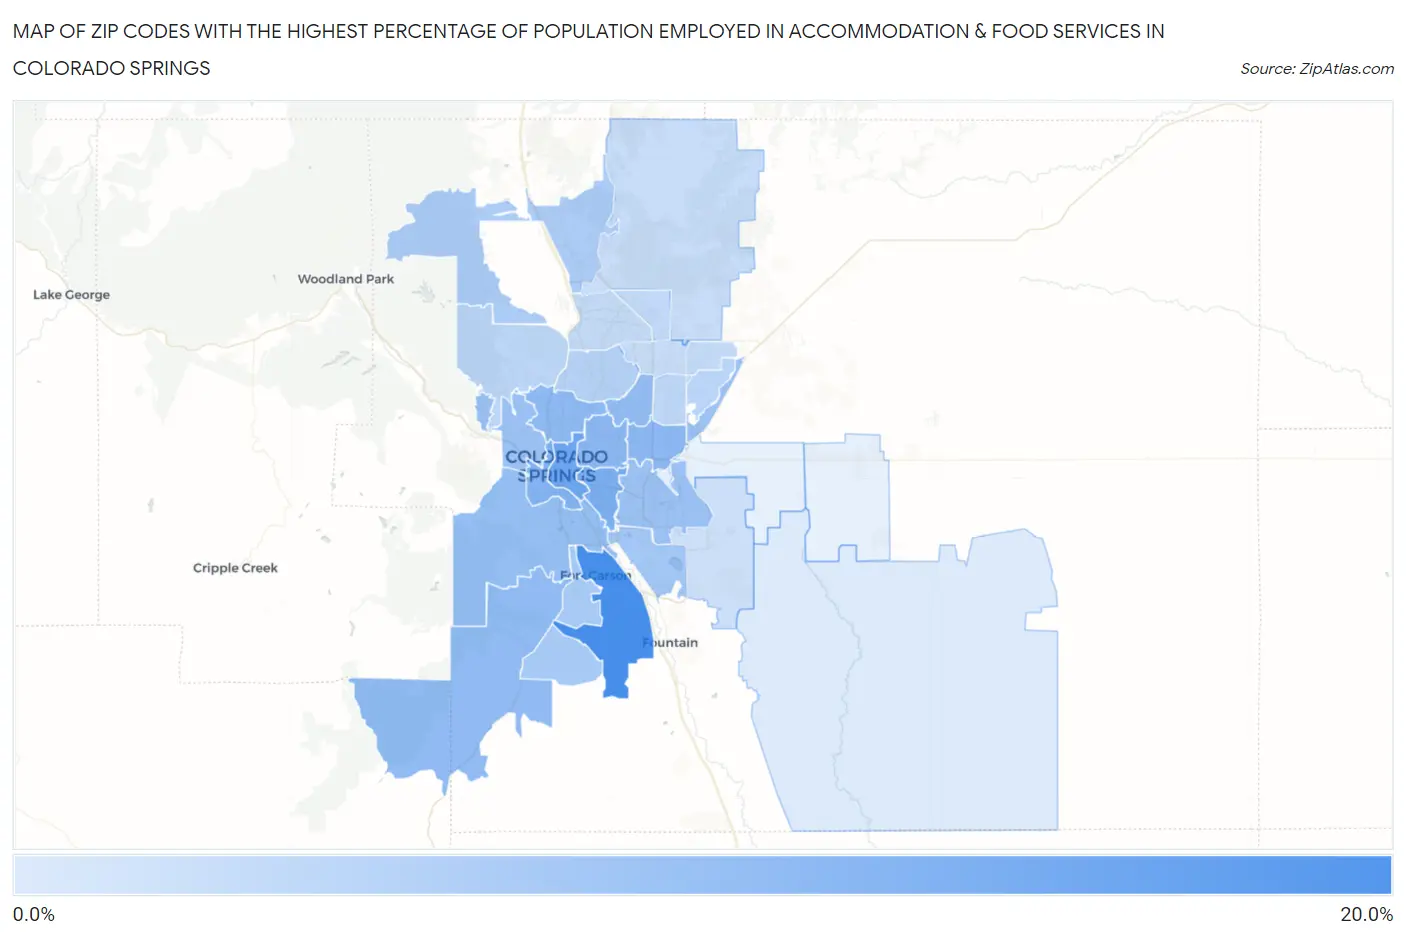
Map of Zip Codes with the Highest Percentage of Population Employed in Accommodation & Food Services in Colorado Springs
0.0%
20.0%
Zip Codes with the Highest Percentage of Population Employed in Accommodation & Food Services in Colorado Springs, CO
| Zip Code | % Employed | vs State | vs National | |
| 1. | 80913 | 16.7% | 6.9%(+9.81)#23 | 6.9%(+9.83)#1,305 |
| 2. | 80903 | 12.6% | 6.9%(+5.73)#49 | 6.9%(+5.75)#2,510 |
| 3. | 80910 | 11.4% | 6.9%(+4.48)#63 | 6.9%(+4.50)#3,246 |
| 4. | 80905 | 10.5% | 6.9%(+3.60)#84 | 6.9%(+3.62)#3,987 |
| 5. | 80915 | 9.6% | 6.9%(+2.74)#97 | 6.9%(+2.76)#5,007 |
| 6. | 80909 | 9.6% | 6.9%(+2.69)#99 | 6.9%(+2.71)#5,081 |
| 7. | 80907 | 9.4% | 6.9%(+2.48)#104 | 6.9%(+2.50)#5,378 |
| 8. | 80926 | 9.2% | 6.9%(+2.25)#107 | 6.9%(+2.27)#5,729 |
| 9. | 80917 | 9.0% | 6.9%(+2.10)#112 | 6.9%(+2.12)#5,954 |
| 10. | 80906 | 8.7% | 6.9%(+1.79)#121 | 6.9%(+1.81)#6,493 |
| 11. | 80951 | 8.4% | 6.9%(+1.45)#127 | 6.9%(+1.47)#7,085 |
| 12. | 80904 | 8.3% | 6.9%(+1.38)#128 | 6.9%(+1.40)#7,257 |
| 13. | 80916 | 8.2% | 6.9%(+1.28)#133 | 6.9%(+1.30)#7,454 |
| 14. | 80911 | 7.4% | 6.9%(+0.520)#157 | 6.9%(+0.540)#9,198 |
| 15. | 80902 | 7.0% | 6.9%(+0.097)#177 | 6.9%(+0.117)#10,314 |
| 16. | 80921 | 6.5% | 6.9%(-0.402)#198 | 6.9%(-0.382)#11,858 |
| 17. | 80918 | 5.6% | 6.9%(-1.28)#238 | 6.9%(-1.26)#14,628 |
| 18. | 80938 | 5.2% | 6.9%(-1.74)#271 | 6.9%(-1.71)#16,223 |
| 19. | 80919 | 5.1% | 6.9%(-1.79)#273 | 6.9%(-1.77)#16,408 |
| 20. | 80922 | 4.8% | 6.9%(-2.15)#297 | 6.9%(-2.13)#17,631 |
| 21. | 80924 | 4.6% | 6.9%(-2.25)#303 | 6.9%(-2.23)#17,993 |
| 22. | 80920 | 4.5% | 6.9%(-2.44)#309 | 6.9%(-2.42)#18,633 |
| 23. | 80927 | 4.3% | 6.9%(-2.55)#315 | 6.9%(-2.53)#19,005 |
| 24. | 80908 | 4.0% | 6.9%(-2.92)#323 | 6.9%(-2.90)#20,200 |
| 25. | 80923 | 3.9% | 6.9%(-3.01)#330 | 6.9%(-2.99)#20,511 |
| 26. | 80925 | 3.6% | 6.9%(-3.30)#338 | 6.9%(-3.28)#21,457 |
| 27. | 80928 | 2.1% | 6.9%(-4.85)#392 | 6.9%(-4.83)#25,447 |
1
Common Questions
What are the Top 10 Zip Codes with the Highest Percentage of Population Employed in Accommodation & Food Services in Colorado Springs, CO?
Top 10 Zip Codes with the Highest Percentage of Population Employed in Accommodation & Food Services in Colorado Springs, CO are:
What zip code has the Highest Percentage of Population Employed in Accommodation & Food Services in Colorado Springs, CO?
80913 has the Highest Percentage of Population Employed in Accommodation & Food Services in Colorado Springs, CO with 16.7%.
What is the Percentage of Population Employed in Accommodation & Food Services in Colorado Springs, CO?
Percentage of Population Employed in Accommodation & Food Services in Colorado Springs is 7.4%.
What is the Percentage of Population Employed in Accommodation & Food Services in Colorado?
Percentage of Population Employed in Accommodation & Food Services in Colorado is 6.9%.
What is the Percentage of Population Employed in Accommodation & Food Services in the United States?
Percentage of Population Employed in Accommodation & Food Services in the United States is 6.9%.