Zip Codes with the Highest Percentage of Population Employed in Accommodation & Food Services in Grand Junction, CO
RELATED REPORTS & OPTIONS
Accommodation & Food Services
Grand Junction
Compare Zip Codes
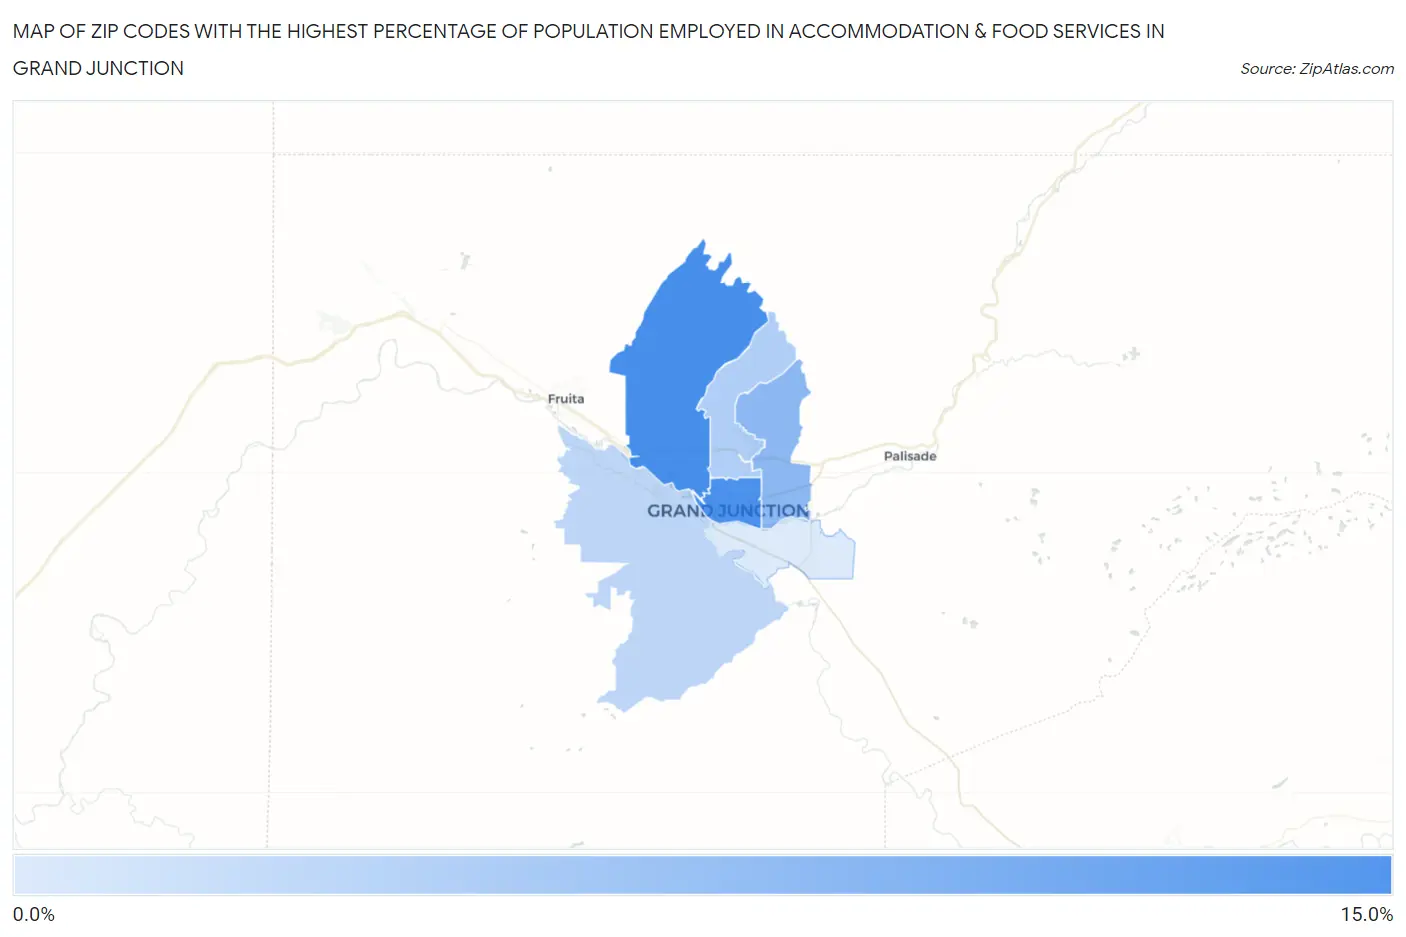
Map of Zip Codes with the Highest Percentage of Population Employed in Accommodation & Food Services in Grand Junction
2.6%
11.1%
Zip Codes with the Highest Percentage of Population Employed in Accommodation & Food Services in Grand Junction, CO
| Zip Code | % Employed | vs State | vs National | |
| 1. | 81505 | 11.1% | 6.9%(+4.20)#72 | 6.9%(+4.22)#3,480 |
| 2. | 81501 | 10.9% | 6.9%(+3.97)#78 | 6.9%(+3.99)#3,658 |
| 3. | 81504 | 7.1% | 6.9%(+0.158)#175 | 6.9%(+0.178)#10,154 |
| 4. | 81506 | 5.0% | 6.9%(-1.91)#281 | 6.9%(-1.89)#16,846 |
| 5. | 81507 | 4.3% | 6.9%(-2.57)#318 | 6.9%(-2.55)#19,072 |
| 6. | 81503 | 2.6% | 6.9%(-4.28)#371 | 6.9%(-4.26)#24,193 |
1
Common Questions
What are the Top 5 Zip Codes with the Highest Percentage of Population Employed in Accommodation & Food Services in Grand Junction, CO?
Top 5 Zip Codes with the Highest Percentage of Population Employed in Accommodation & Food Services in Grand Junction, CO are:
What zip code has the Highest Percentage of Population Employed in Accommodation & Food Services in Grand Junction, CO?
81505 has the Highest Percentage of Population Employed in Accommodation & Food Services in Grand Junction, CO with 11.1%.
What is the Percentage of Population Employed in Accommodation & Food Services in Grand Junction, CO?
Percentage of Population Employed in Accommodation & Food Services in Grand Junction is 8.3%.
What is the Percentage of Population Employed in Accommodation & Food Services in Colorado?
Percentage of Population Employed in Accommodation & Food Services in Colorado is 6.9%.
What is the Percentage of Population Employed in Accommodation & Food Services in the United States?
Percentage of Population Employed in Accommodation & Food Services in the United States is 6.9%.