Zip Codes with the Highest Percentage of Population Employed in Architecture & Engineering in Hesperia, CA
RELATED REPORTS & OPTIONS
Architecture & Engineering
Hesperia
Compare Zip Codes
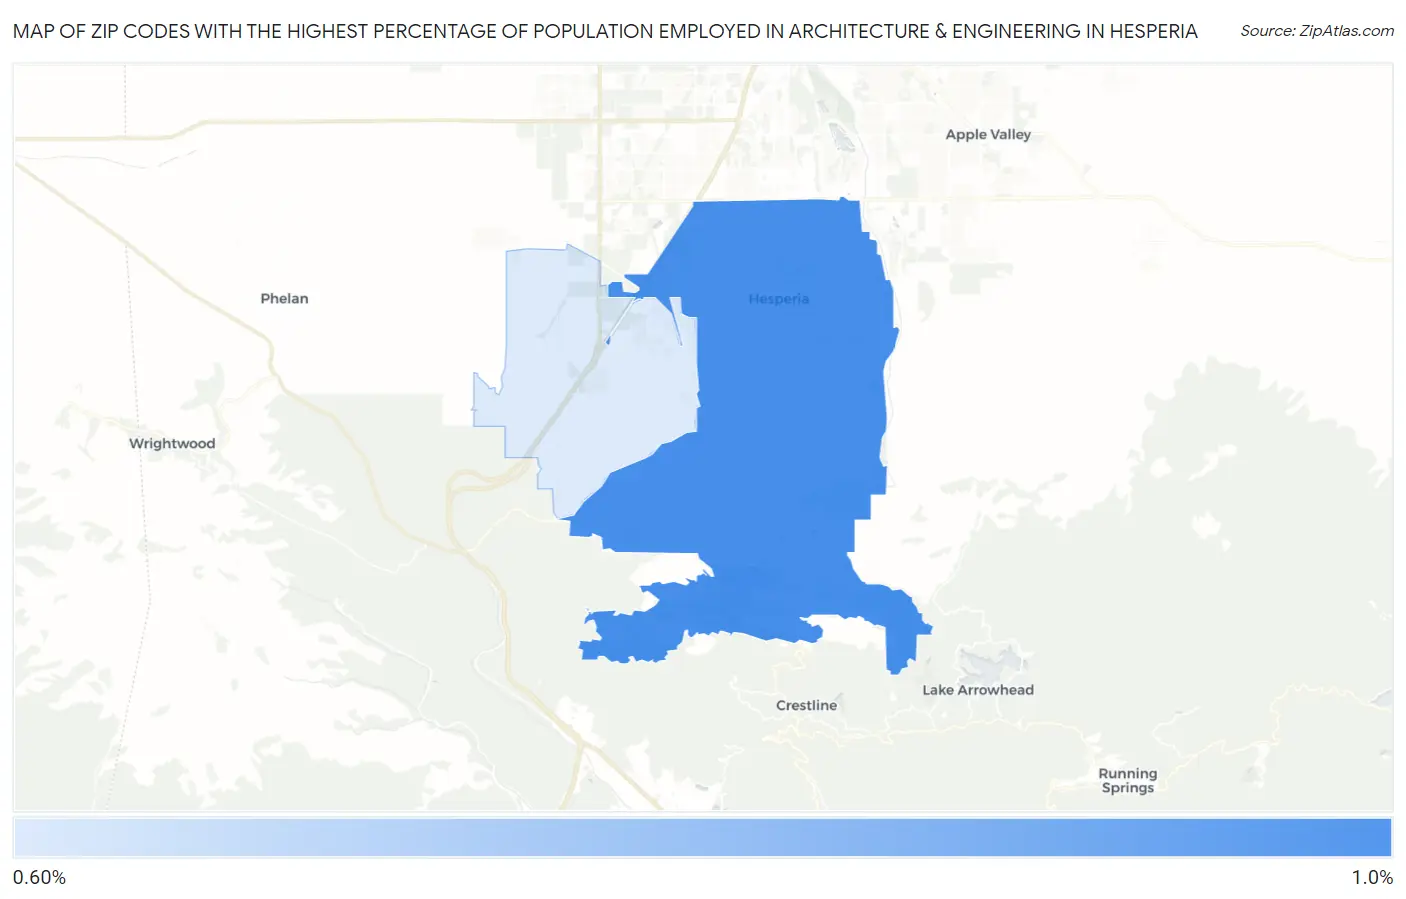
Map of Zip Codes with the Highest Percentage of Population Employed in Architecture & Engineering in Hesperia
0.69%
0.93%
Zip Codes with the Highest Percentage of Population Employed in Architecture & Engineering in Hesperia, CA
| Zip Code | % Employed | vs State | vs National | |
| 1. | 92345 | 0.93% | 2.6%(-1.62)#1,069 | 2.1%(-1.22)#17,109 |
| 2. | 92344 | 0.69% | 2.6%(-1.86)#1,151 | 2.1%(-1.46)#18,971 |
1
Common Questions
What are the Top Zip Codes with the Highest Percentage of Population Employed in Architecture & Engineering in Hesperia, CA?
Top Zip Codes with the Highest Percentage of Population Employed in Architecture & Engineering in Hesperia, CA are:
What zip code has the Highest Percentage of Population Employed in Architecture & Engineering in Hesperia, CA?
92345 has the Highest Percentage of Population Employed in Architecture & Engineering in Hesperia, CA with 0.93%.
What is the Percentage of Population Employed in Architecture & Engineering in Hesperia, CA?
Percentage of Population Employed in Architecture & Engineering in Hesperia is 0.84%.
What is the Percentage of Population Employed in Architecture & Engineering in California?
Percentage of Population Employed in Architecture & Engineering in California is 2.6%.
What is the Percentage of Population Employed in Architecture & Engineering in the United States?
Percentage of Population Employed in Architecture & Engineering in the United States is 2.1%.