Zip Codes with the Highest Percentage of Population Employed in Architecture & Engineering in El Monte, CA
RELATED REPORTS & OPTIONS
Architecture & Engineering
El Monte
Compare Zip Codes
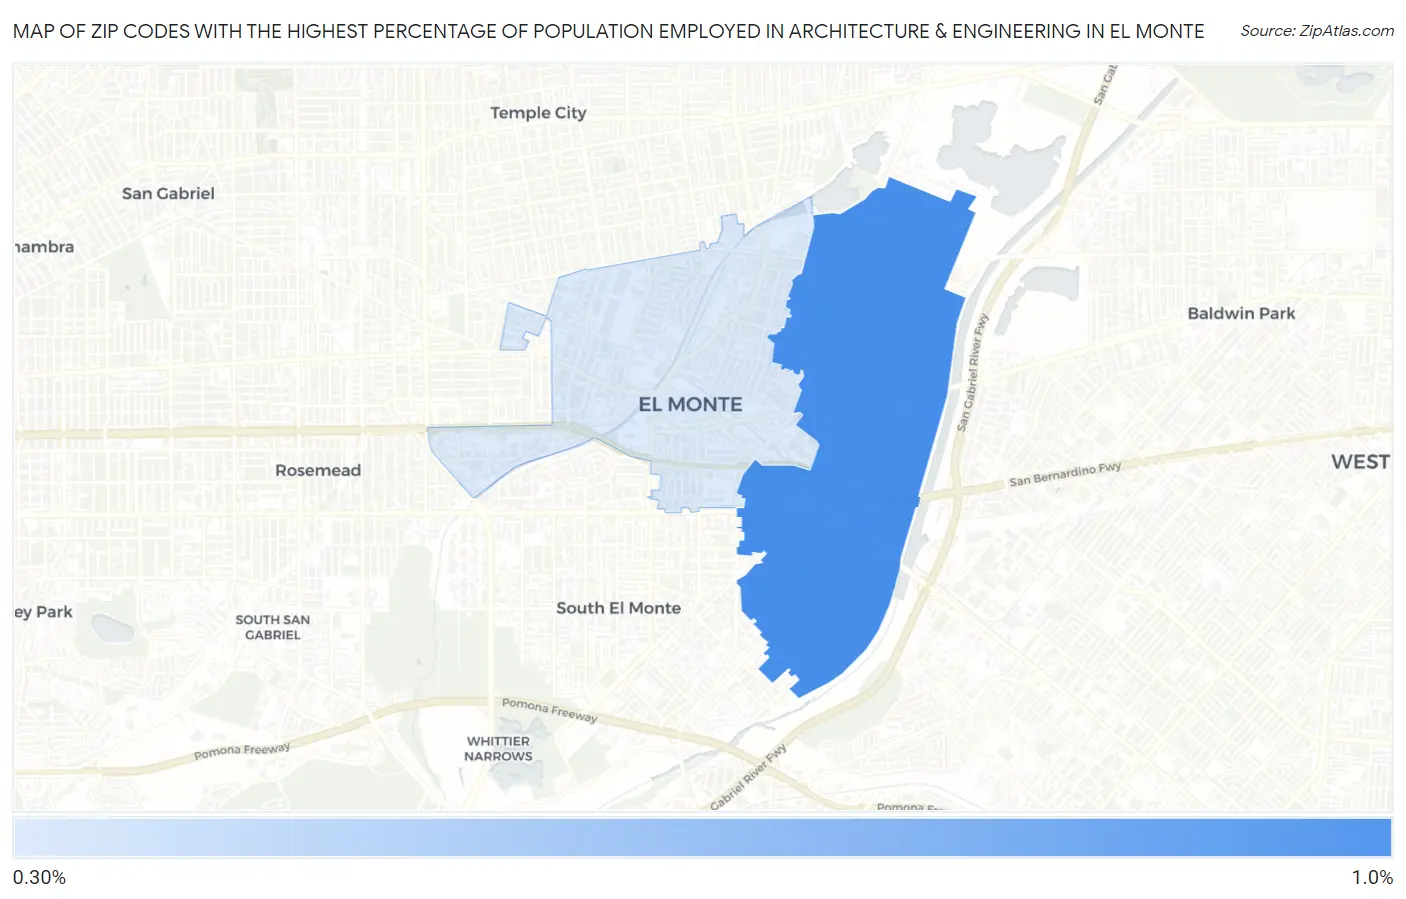
Map of Zip Codes with the Highest Percentage of Population Employed in Architecture & Engineering in El Monte
0.37%
0.91%
Zip Codes with the Highest Percentage of Population Employed in Architecture & Engineering in El Monte, CA
| Zip Code | % Employed | vs State | vs National | |
| 1. | 91732 | 0.91% | 2.6%(-1.65)#1,077 | 2.1%(-1.24)#17,320 |
| 2. | 91731 | 0.37% | 2.6%(-2.18)#1,261 | 2.1%(-1.78)#21,159 |
1
Common Questions
What are the Top Zip Codes with the Highest Percentage of Population Employed in Architecture & Engineering in El Monte, CA?
Top Zip Codes with the Highest Percentage of Population Employed in Architecture & Engineering in El Monte, CA are:
What zip code has the Highest Percentage of Population Employed in Architecture & Engineering in El Monte, CA?
91732 has the Highest Percentage of Population Employed in Architecture & Engineering in El Monte, CA with 0.91%.
What is the Percentage of Population Employed in Architecture & Engineering in El Monte, CA?
Percentage of Population Employed in Architecture & Engineering in El Monte is 0.85%.
What is the Percentage of Population Employed in Architecture & Engineering in California?
Percentage of Population Employed in Architecture & Engineering in California is 2.6%.
What is the Percentage of Population Employed in Architecture & Engineering in the United States?
Percentage of Population Employed in Architecture & Engineering in the United States is 2.1%.