Zip Codes with the Highest Percentage of Population Employed in Architecture & Engineering in Brea, CA
RELATED REPORTS & OPTIONS
Architecture & Engineering
Brea
Compare Zip Codes
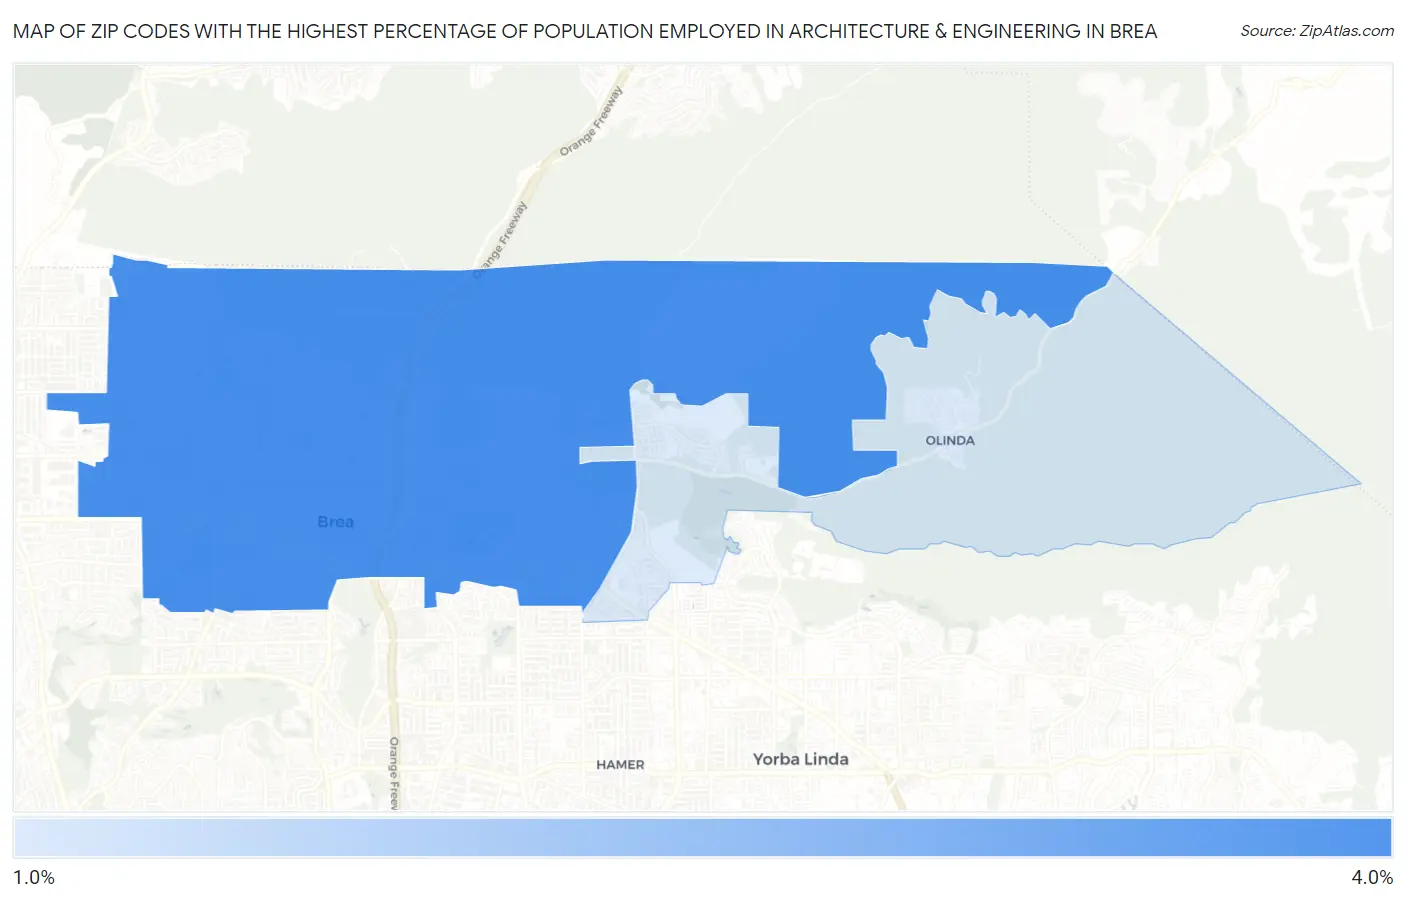
Map of Zip Codes with the Highest Percentage of Population Employed in Architecture & Engineering in Brea
1.7%
3.4%
Zip Codes with the Highest Percentage of Population Employed in Architecture & Engineering in Brea, CA
| Zip Code | % Employed | vs State | vs National | |
| 1. | 92821 | 3.4% | 2.6%(+0.797)#332 | 2.1%(+1.20)#4,069 |
| 2. | 92823 | 1.7% | 2.6%(-0.881)#800 | 2.1%(-0.477)#11,677 |
1
Common Questions
What are the Top Zip Codes with the Highest Percentage of Population Employed in Architecture & Engineering in Brea, CA?
Top Zip Codes with the Highest Percentage of Population Employed in Architecture & Engineering in Brea, CA are:
What zip code has the Highest Percentage of Population Employed in Architecture & Engineering in Brea, CA?
92821 has the Highest Percentage of Population Employed in Architecture & Engineering in Brea, CA with 3.4%.
What is the Percentage of Population Employed in Architecture & Engineering in Brea, CA?
Percentage of Population Employed in Architecture & Engineering in Brea is 3.2%.
What is the Percentage of Population Employed in Architecture & Engineering in California?
Percentage of Population Employed in Architecture & Engineering in California is 2.6%.
What is the Percentage of Population Employed in Architecture & Engineering in the United States?
Percentage of Population Employed in Architecture & Engineering in the United States is 2.1%.