Zip Codes with the Highest Percentage of Population Employed in Architecture & Engineering in Malibu, CA
RELATED REPORTS & OPTIONS
Architecture & Engineering
Malibu
Compare Zip Codes
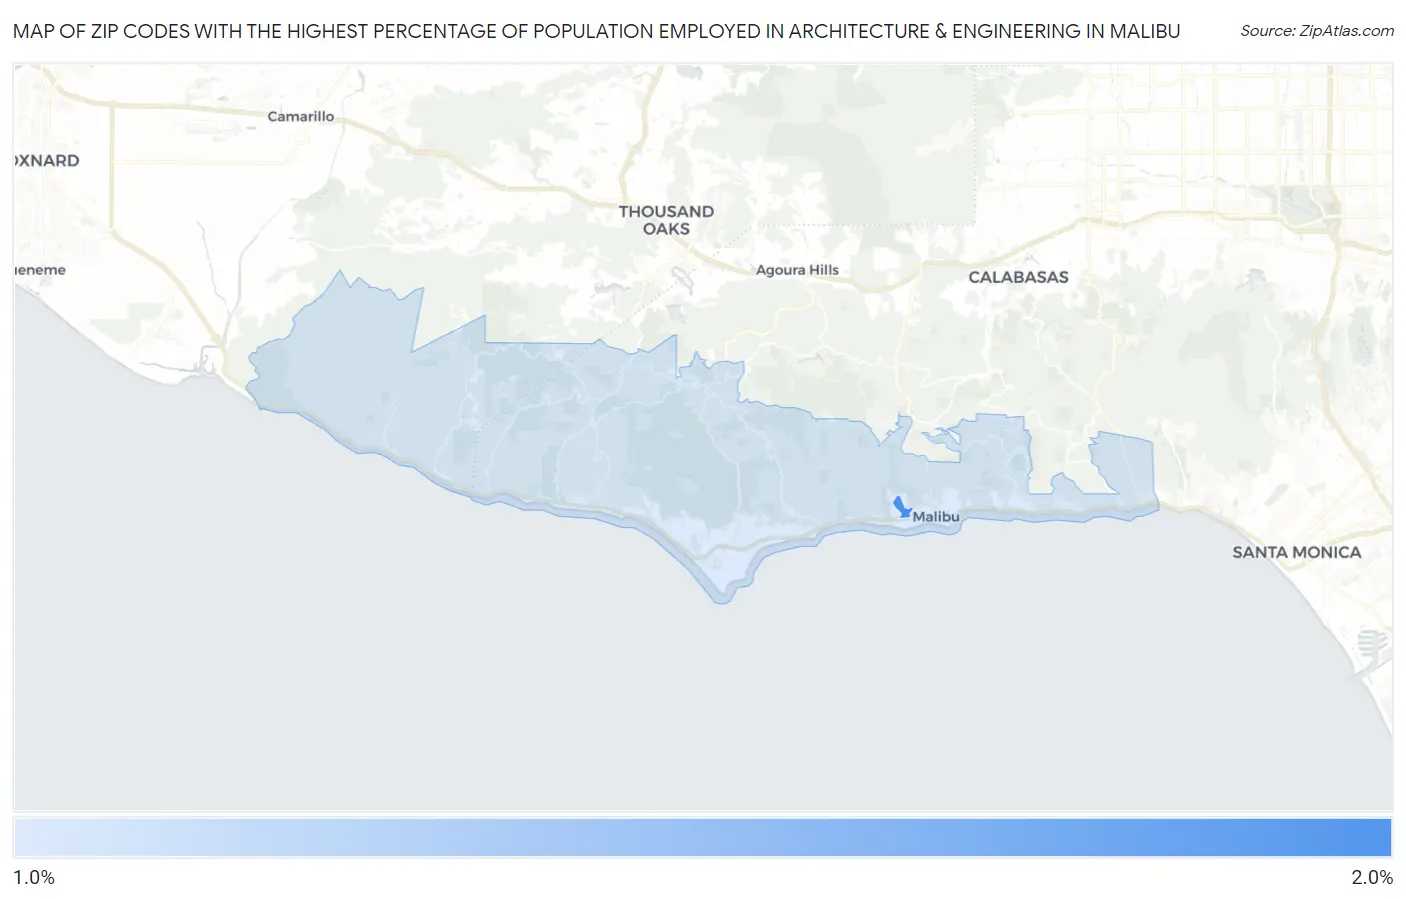
Map of Zip Codes with the Highest Percentage of Population Employed in Architecture & Engineering in Malibu
1.2%
1.6%
Zip Codes with the Highest Percentage of Population Employed in Architecture & Engineering in Malibu, CA
| Zip Code | % Employed | vs State | vs National | |
| 1. | 90263 | 1.6% | 2.6%(-0.987)#839 | 2.1%(-0.582)#12,393 |
| 2. | 90265 | 1.2% | 2.6%(-1.39)#975 | 2.1%(-0.990)#15,404 |
1
Common Questions
What are the Top Zip Codes with the Highest Percentage of Population Employed in Architecture & Engineering in Malibu, CA?
Top Zip Codes with the Highest Percentage of Population Employed in Architecture & Engineering in Malibu, CA are:
What zip code has the Highest Percentage of Population Employed in Architecture & Engineering in Malibu, CA?
90263 has the Highest Percentage of Population Employed in Architecture & Engineering in Malibu, CA with 1.6%.
What is the Percentage of Population Employed in Architecture & Engineering in Malibu, CA?
Percentage of Population Employed in Architecture & Engineering in Malibu is 0.65%.
What is the Percentage of Population Employed in Architecture & Engineering in California?
Percentage of Population Employed in Architecture & Engineering in California is 2.6%.
What is the Percentage of Population Employed in Architecture & Engineering in the United States?
Percentage of Population Employed in Architecture & Engineering in the United States is 2.1%.