Zip Codes with the Highest Percentage of Population Employed in Architecture & Engineering in Sacramento, CA
RELATED REPORTS & OPTIONS
Architecture & Engineering
Sacramento
Compare Zip Codes
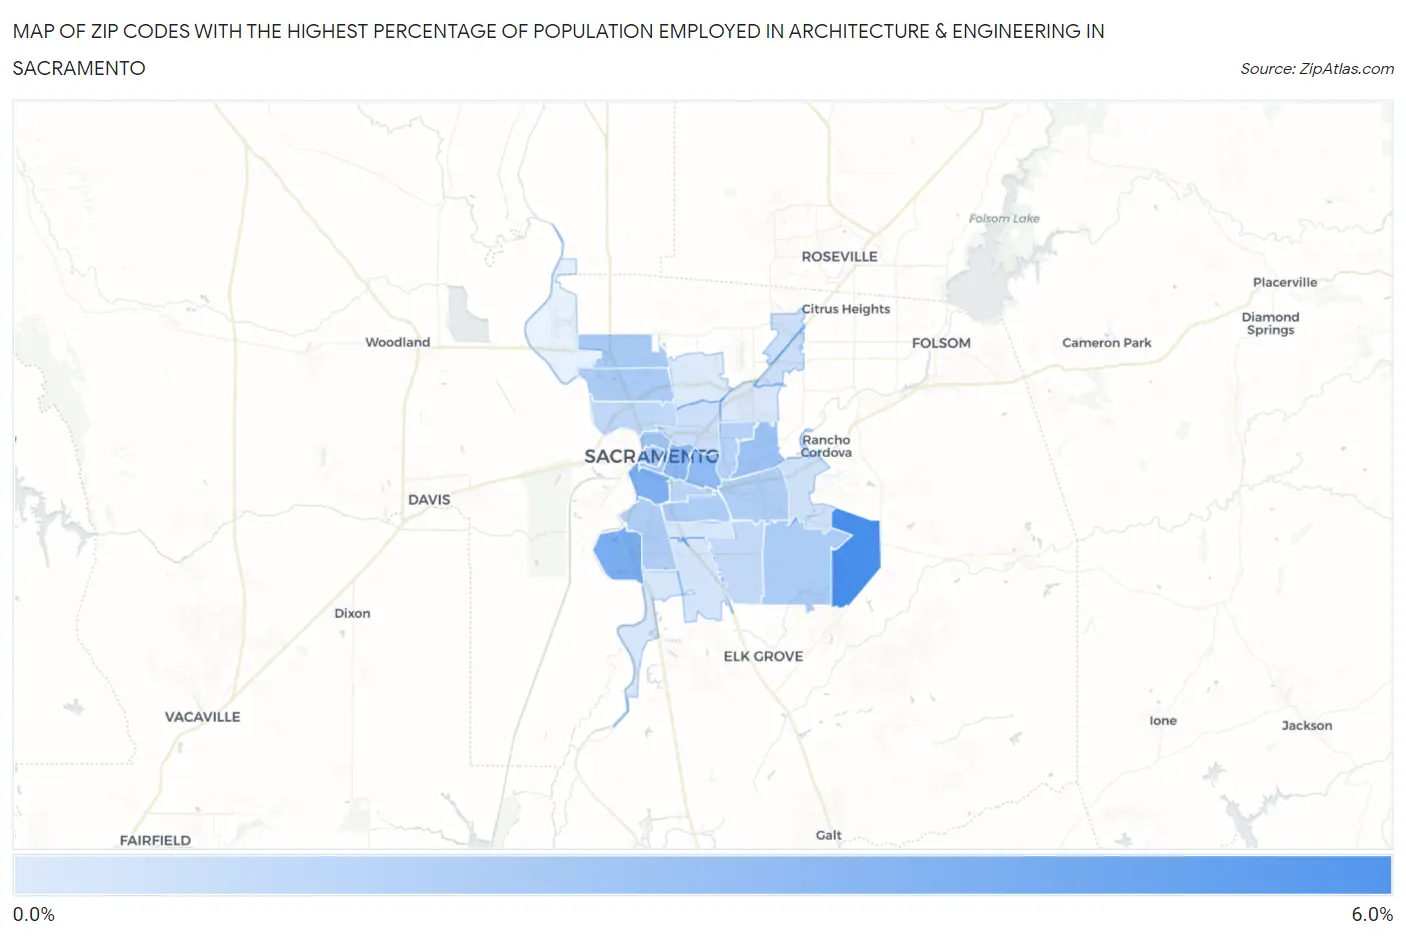
Map of Zip Codes with the Highest Percentage of Population Employed in Architecture & Engineering in Sacramento
0.64%
5.7%
Zip Codes with the Highest Percentage of Population Employed in Architecture & Engineering in Sacramento, CA
| Zip Code | % Employed | vs State | vs National | |
| 1. | 95830 | 5.7% | 2.6%(+3.14)#121 | 2.1%(+3.54)#1,220 |
| 2. | 95831 | 3.9% | 2.6%(+1.37)#248 | 2.1%(+1.78)#2,890 |
| 3. | 95818 | 3.8% | 2.6%(+1.21)#273 | 2.1%(+1.61)#3,177 |
| 4. | 95816 | 3.4% | 2.6%(+0.798)#331 | 2.1%(+1.20)#4,067 |
| 5. | 95819 | 3.3% | 2.6%(+0.701)#350 | 2.1%(+1.11)#4,311 |
| 6. | 95864 | 2.8% | 2.6%(+0.286)#428 | 2.1%(+0.691)#5,621 |
| 7. | 95811 | 2.6% | 2.6%(+0.059)#498 | 2.1%(+0.464)#6,517 |
| 8. | 95835 | 2.4% | 2.6%(-0.156)#560 | 2.1%(+0.249)#7,485 |
| 9. | 95814 | 2.4% | 2.6%(-0.168)#566 | 2.1%(+0.237)#7,541 |
| 10. | 95834 | 2.3% | 2.6%(-0.205)#579 | 2.1%(+0.200)#7,719 |
| 11. | 95829 | 2.2% | 2.6%(-0.316)#614 | 2.1%(+0.089)#8,266 |
| 12. | 95820 | 2.2% | 2.6%(-0.331)#620 | 2.1%(+0.073)#8,354 |
| 13. | 95822 | 2.2% | 2.6%(-0.362)#628 | 2.1%(+0.043)#8,510 |
| 14. | 95826 | 2.1% | 2.6%(-0.421)#648 | 2.1%(-0.016)#8,850 |
| 15. | 95825 | 1.9% | 2.6%(-0.609)#709 | 2.1%(-0.204)#9,952 |
| 16. | 95817 | 1.8% | 2.6%(-0.761)#761 | 2.1%(-0.356)#10,862 |
| 17. | 95833 | 1.6% | 2.6%(-0.933)#824 | 2.1%(-0.529)#12,045 |
| 18. | 95828 | 1.6% | 2.6%(-0.993)#845 | 2.1%(-0.588)#12,439 |
| 19. | 95815 | 1.3% | 2.6%(-1.29)#944 | 2.1%(-0.885)#14,571 |
| 20. | 95841 | 1.2% | 2.6%(-1.32)#955 | 2.1%(-0.917)#14,826 |
| 21. | 95842 | 1.2% | 2.6%(-1.33)#957 | 2.1%(-0.921)#14,849 |
| 22. | 95827 | 1.1% | 2.6%(-1.47)#1,011 | 2.1%(-1.07)#16,020 |
| 23. | 95823 | 0.97% | 2.6%(-1.59)#1,052 | 2.1%(-1.18)#16,858 |
| 24. | 95832 | 0.89% | 2.6%(-1.66)#1,084 | 2.1%(-1.26)#17,437 |
| 25. | 95824 | 0.85% | 2.6%(-1.71)#1,100 | 2.1%(-1.30)#17,780 |
| 26. | 95821 | 0.82% | 2.6%(-1.73)#1,111 | 2.1%(-1.33)#17,959 |
| 27. | 95838 | 0.64% | 2.6%(-1.91)#1,172 | 2.1%(-1.51)#19,326 |
1
Common Questions
What are the Top 10 Zip Codes with the Highest Percentage of Population Employed in Architecture & Engineering in Sacramento, CA?
Top 10 Zip Codes with the Highest Percentage of Population Employed in Architecture & Engineering in Sacramento, CA are:
What zip code has the Highest Percentage of Population Employed in Architecture & Engineering in Sacramento, CA?
95830 has the Highest Percentage of Population Employed in Architecture & Engineering in Sacramento, CA with 5.7%.
What is the Percentage of Population Employed in Architecture & Engineering in Sacramento, CA?
Percentage of Population Employed in Architecture & Engineering in Sacramento is 2.2%.
What is the Percentage of Population Employed in Architecture & Engineering in California?
Percentage of Population Employed in Architecture & Engineering in California is 2.6%.
What is the Percentage of Population Employed in Architecture & Engineering in the United States?
Percentage of Population Employed in Architecture & Engineering in the United States is 2.1%.