Zip Codes with the Highest Percentage of Population Employed in Architecture & Engineering in Madera, CA
RELATED REPORTS & OPTIONS
Architecture & Engineering
Madera
Compare Zip Codes
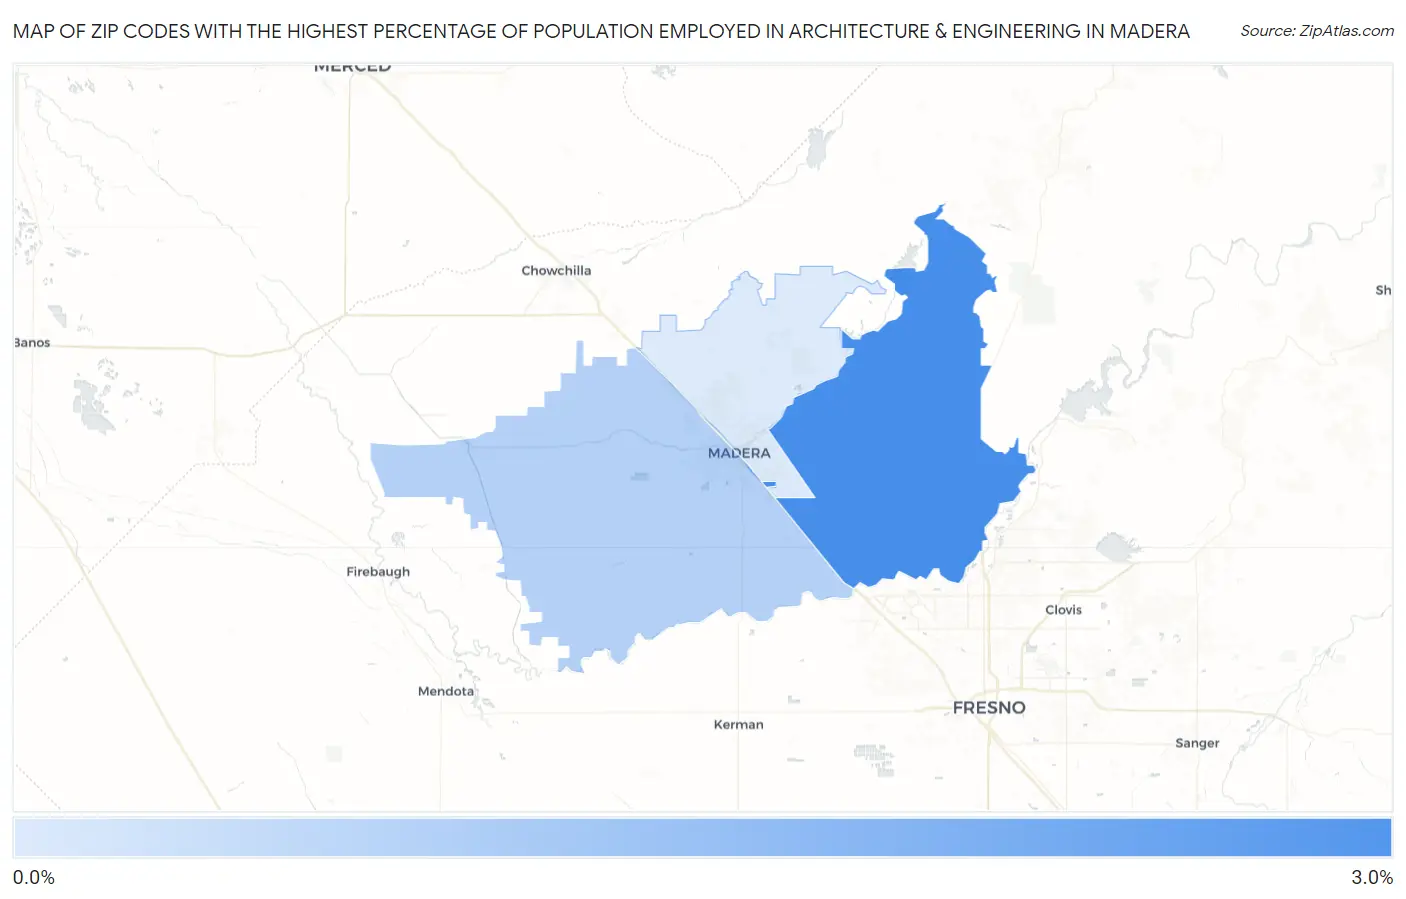
Map of Zip Codes with the Highest Percentage of Population Employed in Architecture & Engineering in Madera
0.38%
2.7%
Zip Codes with the Highest Percentage of Population Employed in Architecture & Engineering in Madera, CA
| Zip Code | % Employed | vs State | vs National | |
| 1. | 93636 | 2.7% | 2.6%(+0.115)#480 | 2.1%(+0.519)#6,295 |
| 2. | 93637 | 1.0% | 2.6%(-1.53)#1,034 | 2.1%(-1.13)#16,468 |
| 3. | 93638 | 0.38% | 2.6%(-2.17)#1,258 | 2.1%(-1.77)#21,088 |
1
Common Questions
What are the Top Zip Codes with the Highest Percentage of Population Employed in Architecture & Engineering in Madera, CA?
Top Zip Codes with the Highest Percentage of Population Employed in Architecture & Engineering in Madera, CA are:
What zip code has the Highest Percentage of Population Employed in Architecture & Engineering in Madera, CA?
93636 has the Highest Percentage of Population Employed in Architecture & Engineering in Madera, CA with 2.7%.
What is the Percentage of Population Employed in Architecture & Engineering in Madera, CA?
Percentage of Population Employed in Architecture & Engineering in Madera is 0.73%.
What is the Percentage of Population Employed in Architecture & Engineering in California?
Percentage of Population Employed in Architecture & Engineering in California is 2.6%.
What is the Percentage of Population Employed in Architecture & Engineering in the United States?
Percentage of Population Employed in Architecture & Engineering in the United States is 2.1%.