Zip Codes with the Highest Percentage of Population Employed in Life, Physical & Social Science in Rocklin, CA
RELATED REPORTS & OPTIONS
Life, Physical & Social Science
Rocklin
Compare Zip Codes
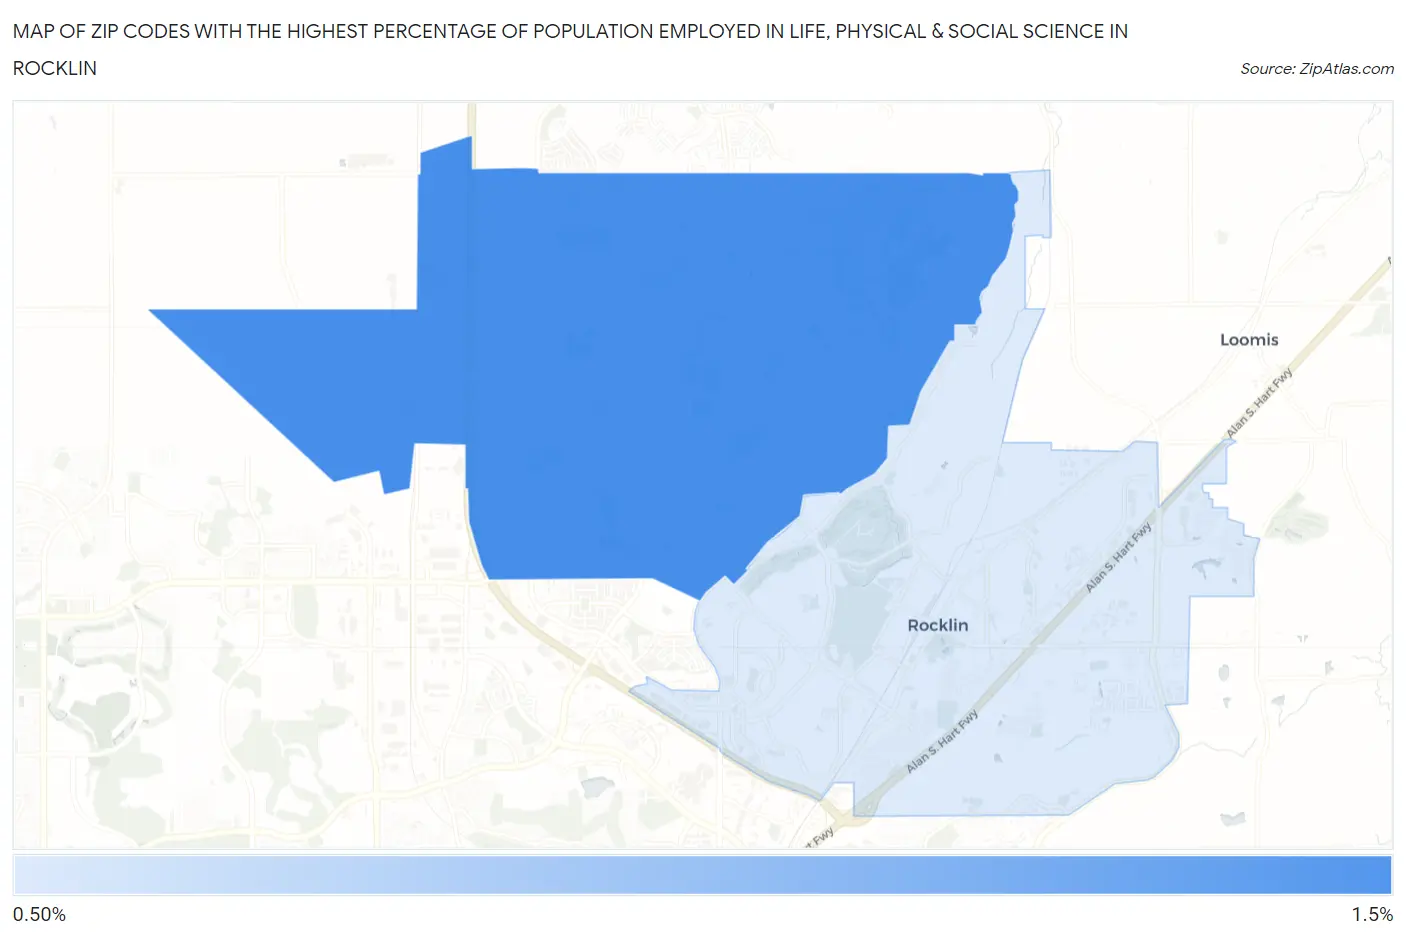
Map of Zip Codes with the Highest Percentage of Population Employed in Life, Physical & Social Science in Rocklin
0.59%
1.2%
Zip Codes with the Highest Percentage of Population Employed in Life, Physical & Social Science in Rocklin, CA
| Zip Code | % Employed | vs State | vs National | |
| 1. | 95765 | 1.2% | 1.3%(-0.082)#602 | 1.1%(+0.135)#7,297 |
| 2. | 95677 | 0.59% | 1.3%(-0.718)#1,015 | 1.1%(-0.501)#13,423 |
1
Common Questions
What are the Top Zip Codes with the Highest Percentage of Population Employed in Life, Physical & Social Science in Rocklin, CA?
Top Zip Codes with the Highest Percentage of Population Employed in Life, Physical & Social Science in Rocklin, CA are:
What zip code has the Highest Percentage of Population Employed in Life, Physical & Social Science in Rocklin, CA?
95765 has the Highest Percentage of Population Employed in Life, Physical & Social Science in Rocklin, CA with 1.2%.
What is the Percentage of Population Employed in Life, Physical & Social Science in Rocklin, CA?
Percentage of Population Employed in Life, Physical & Social Science in Rocklin is 0.97%.
What is the Percentage of Population Employed in Life, Physical & Social Science in California?
Percentage of Population Employed in Life, Physical & Social Science in California is 1.3%.
What is the Percentage of Population Employed in Life, Physical & Social Science in the United States?
Percentage of Population Employed in Life, Physical & Social Science in the United States is 1.1%.