Zip Codes with the Highest Percentage of Population Employed in Life, Physical & Social Science in Oroville, CA
RELATED REPORTS & OPTIONS
Life, Physical & Social Science
Oroville
Compare Zip Codes
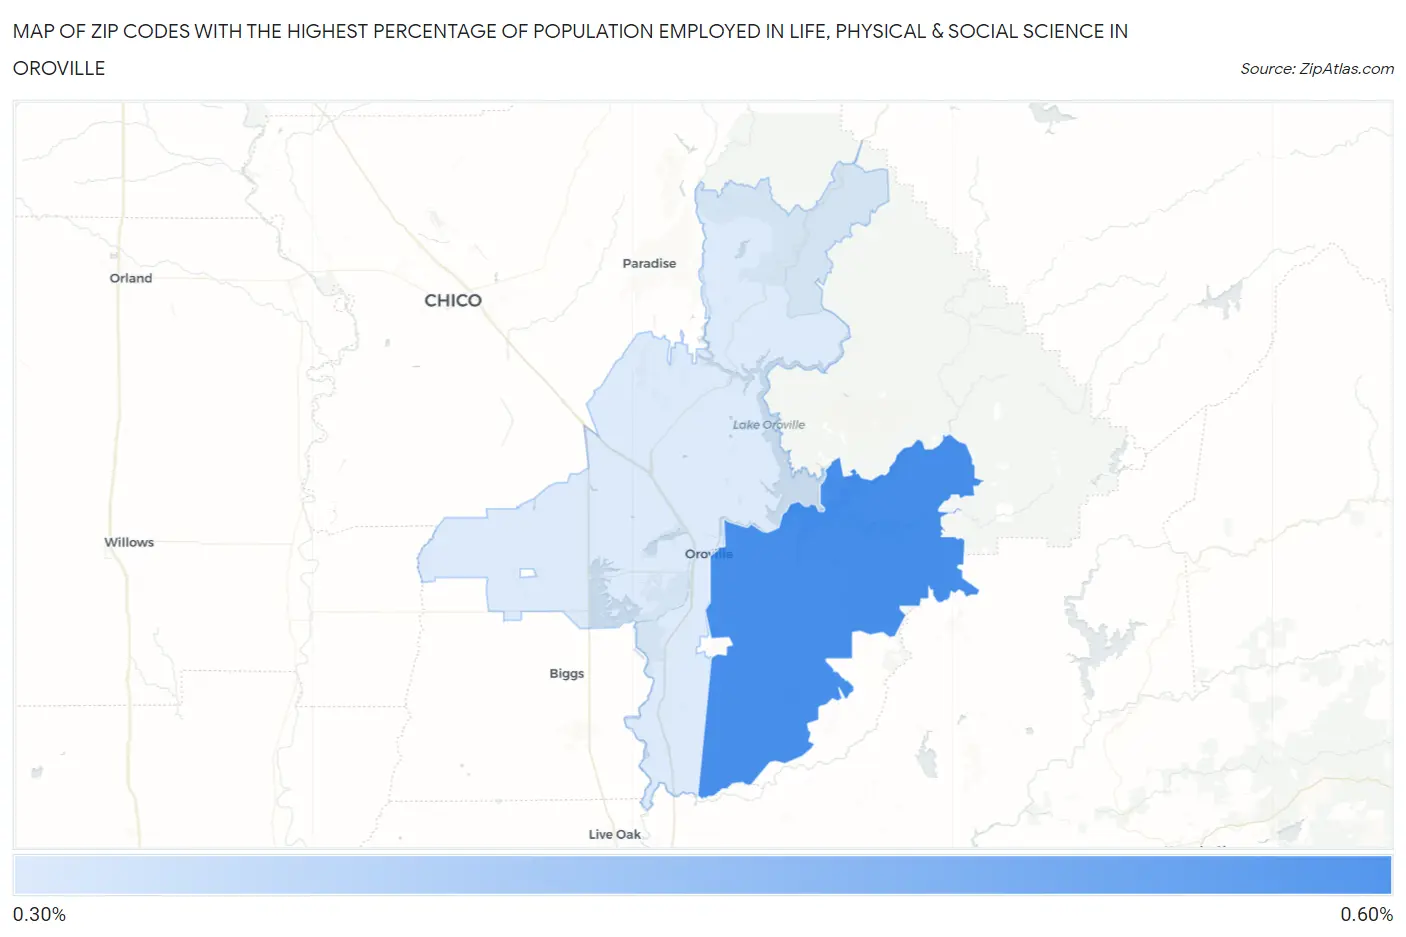
Map of Zip Codes with the Highest Percentage of Population Employed in Life, Physical & Social Science in Oroville
0.37%
0.52%
Zip Codes with the Highest Percentage of Population Employed in Life, Physical & Social Science in Oroville, CA
| Zip Code | % Employed | vs State | vs National | |
| 1. | 95966 | 0.52% | 1.3%(-0.793)#1,067 | 1.1%(-0.576)#14,316 |
| 2. | 95965 | 0.37% | 1.3%(-0.941)#1,160 | 1.1%(-0.724)#16,176 |
1
Common Questions
What are the Top Zip Codes with the Highest Percentage of Population Employed in Life, Physical & Social Science in Oroville, CA?
Top Zip Codes with the Highest Percentage of Population Employed in Life, Physical & Social Science in Oroville, CA are:
What zip code has the Highest Percentage of Population Employed in Life, Physical & Social Science in Oroville, CA?
95966 has the Highest Percentage of Population Employed in Life, Physical & Social Science in Oroville, CA with 0.52%.
What is the Percentage of Population Employed in Life, Physical & Social Science in Oroville, CA?
Percentage of Population Employed in Life, Physical & Social Science in Oroville is 0.22%.
What is the Percentage of Population Employed in Life, Physical & Social Science in California?
Percentage of Population Employed in Life, Physical & Social Science in California is 1.3%.
What is the Percentage of Population Employed in Life, Physical & Social Science in the United States?
Percentage of Population Employed in Life, Physical & Social Science in the United States is 1.1%.