Zip Codes with the Highest Percentage of Population Employed in Life, Physical & Social Science in Rialto, CA
RELATED REPORTS & OPTIONS
Life, Physical & Social Science
Rialto
Compare Zip Codes
Map of Zip Codes with the Highest Percentage of Population Employed in Life, Physical & Social Science in Rialto
0.45%
1.2%
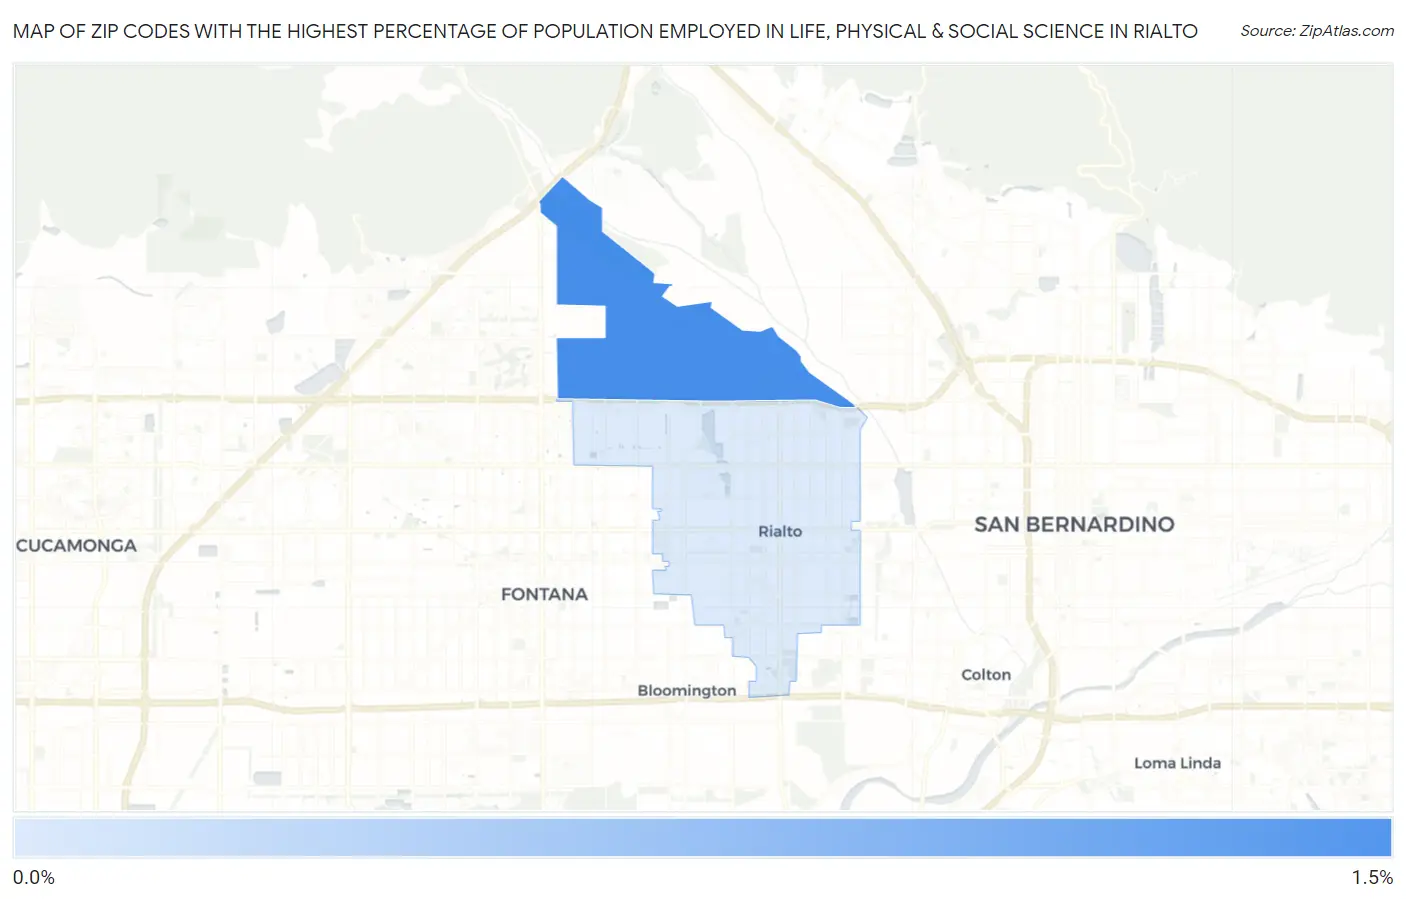
Zip Codes with the Highest Percentage of Population Employed in Life, Physical & Social Science in Rialto, CA
| Zip Code | % Employed | vs State | vs National | |
| 1. | 92377 | 1.2% | 1.3%(-0.115)#626 | 1.1%(+0.102)#7,545 |
| 2. | 92376 | 0.45% | 1.3%(-0.853)#1,107 | 1.1%(-0.636)#15,079 |
1
Common Questions
What are the Top Zip Codes with the Highest Percentage of Population Employed in Life, Physical & Social Science in Rialto, CA?
Top Zip Codes with the Highest Percentage of Population Employed in Life, Physical & Social Science in Rialto, CA are:
What zip code has the Highest Percentage of Population Employed in Life, Physical & Social Science in Rialto, CA?
92377 has the Highest Percentage of Population Employed in Life, Physical & Social Science in Rialto, CA with 1.2%.
What is the Percentage of Population Employed in Life, Physical & Social Science in Rialto, CA?
Percentage of Population Employed in Life, Physical & Social Science in Rialto is 0.61%.
What is the Percentage of Population Employed in Life, Physical & Social Science in California?
Percentage of Population Employed in Life, Physical & Social Science in California is 1.3%.
What is the Percentage of Population Employed in Life, Physical & Social Science in the United States?
Percentage of Population Employed in Life, Physical & Social Science in the United States is 1.1%.