Zip Codes with the Highest Percentage of Population Employed in Life, Physical & Social Science in Eureka, CA
RELATED REPORTS & OPTIONS
Life, Physical & Social Science
Eureka
Compare Zip Codes
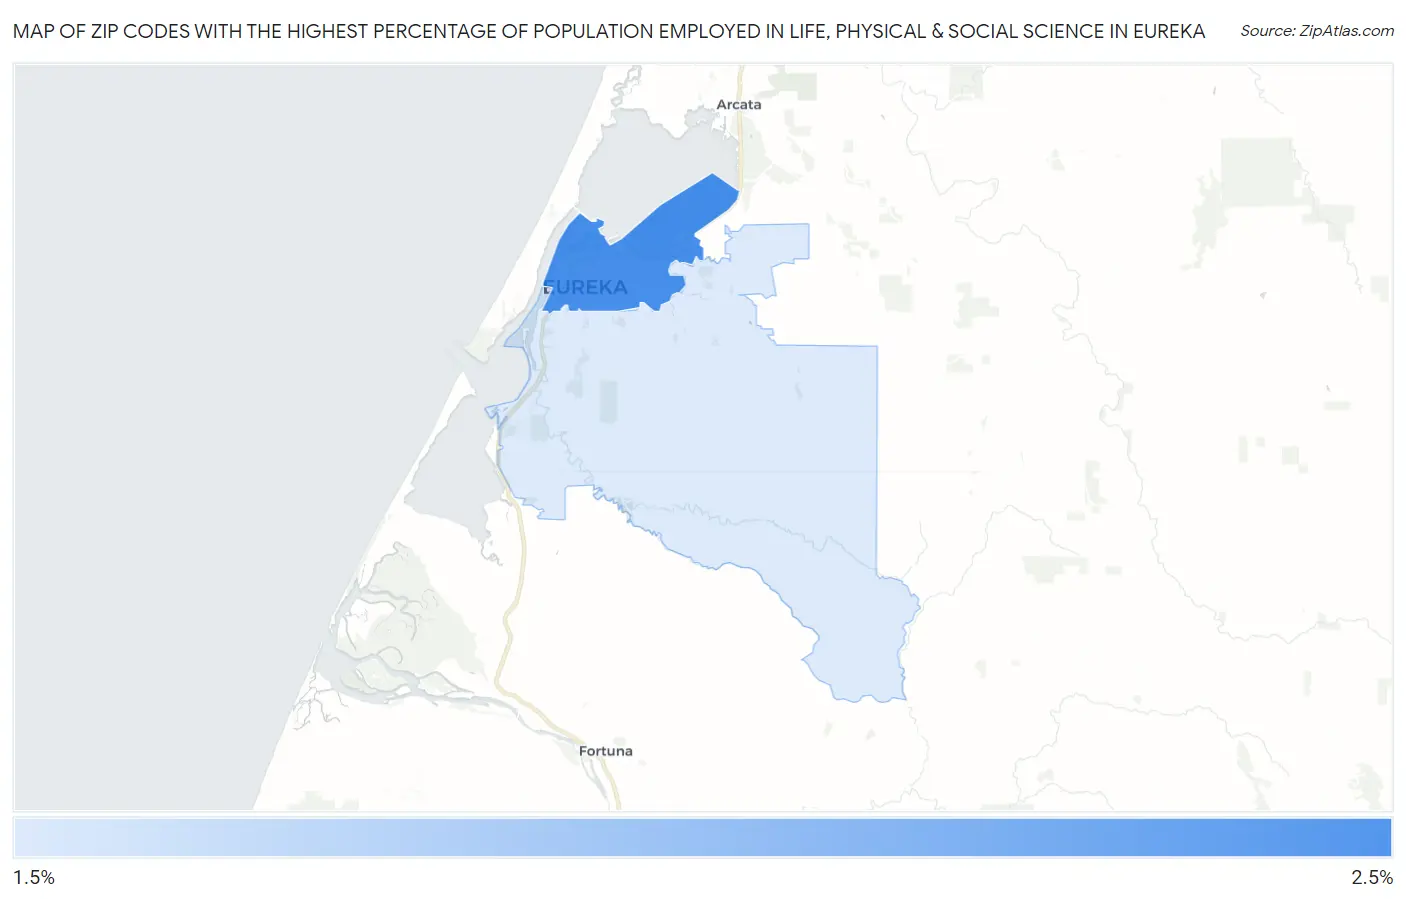
Map of Zip Codes with the Highest Percentage of Population Employed in Life, Physical & Social Science in Eureka
1.8%
2.1%
Zip Codes with the Highest Percentage of Population Employed in Life, Physical & Social Science in Eureka, CA
| Zip Code | % Employed | vs State | vs National | |
| 1. | 95501 | 2.1% | 1.3%(+0.798)#309 | 1.1%(+1.01)#3,411 |
| 2. | 95503 | 1.8% | 1.3%(+0.504)#376 | 1.1%(+0.721)#4,289 |
1
Common Questions
What are the Top Zip Codes with the Highest Percentage of Population Employed in Life, Physical & Social Science in Eureka, CA?
Top Zip Codes with the Highest Percentage of Population Employed in Life, Physical & Social Science in Eureka, CA are:
What zip code has the Highest Percentage of Population Employed in Life, Physical & Social Science in Eureka, CA?
95501 has the Highest Percentage of Population Employed in Life, Physical & Social Science in Eureka, CA with 2.1%.
What is the Percentage of Population Employed in Life, Physical & Social Science in Eureka, CA?
Percentage of Population Employed in Life, Physical & Social Science in Eureka is 2.4%.
What is the Percentage of Population Employed in Life, Physical & Social Science in California?
Percentage of Population Employed in Life, Physical & Social Science in California is 1.3%.
What is the Percentage of Population Employed in Life, Physical & Social Science in the United States?
Percentage of Population Employed in Life, Physical & Social Science in the United States is 1.1%.