Zip Codes with the Highest Percentage of Population Employed in Life, Physical & Social Science in San Jacinto, CA
RELATED REPORTS & OPTIONS
Life, Physical & Social Science
San Jacinto
Compare Zip Codes
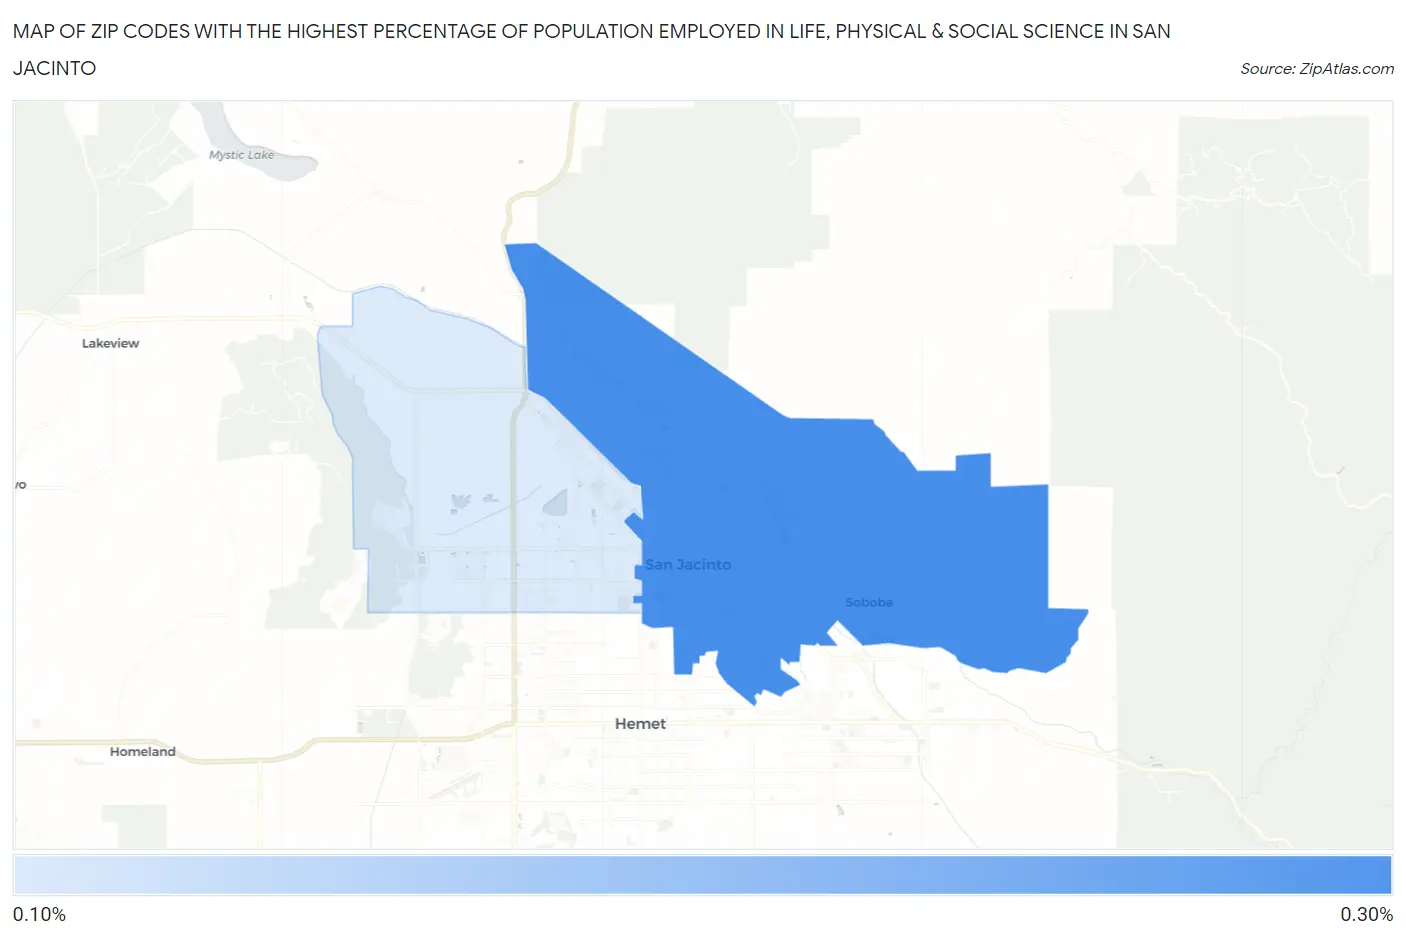
Map of Zip Codes with the Highest Percentage of Population Employed in Life, Physical & Social Science in San Jacinto
0.13%
0.27%
Zip Codes with the Highest Percentage of Population Employed in Life, Physical & Social Science in San Jacinto, CA
| Zip Code | % Employed | vs State | vs National | |
| 1. | 92583 | 0.27% | 1.3%(-1.04)#1,216 | 1.1%(-0.825)#17,462 |
| 2. | 92582 | 0.13% | 1.3%(-1.18)#1,272 | 1.1%(-0.963)#18,878 |
1
Common Questions
What are the Top Zip Codes with the Highest Percentage of Population Employed in Life, Physical & Social Science in San Jacinto, CA?
Top Zip Codes with the Highest Percentage of Population Employed in Life, Physical & Social Science in San Jacinto, CA are:
What zip code has the Highest Percentage of Population Employed in Life, Physical & Social Science in San Jacinto, CA?
92583 has the Highest Percentage of Population Employed in Life, Physical & Social Science in San Jacinto, CA with 0.27%.
What is the Percentage of Population Employed in Life, Physical & Social Science in San Jacinto, CA?
Percentage of Population Employed in Life, Physical & Social Science in San Jacinto is 0.098%.
What is the Percentage of Population Employed in Life, Physical & Social Science in California?
Percentage of Population Employed in Life, Physical & Social Science in California is 1.3%.
What is the Percentage of Population Employed in Life, Physical & Social Science in the United States?
Percentage of Population Employed in Life, Physical & Social Science in the United States is 1.1%.