Zip Codes with the Highest Percentage of Population Employed in Life, Physical & Social Science in Chula Vista, CA
RELATED REPORTS & OPTIONS
Life, Physical & Social Science
Chula Vista
Compare Zip Codes
Map of Zip Codes with the Highest Percentage of Population Employed in Life, Physical & Social Science in Chula Vista
1.1%
1.8%
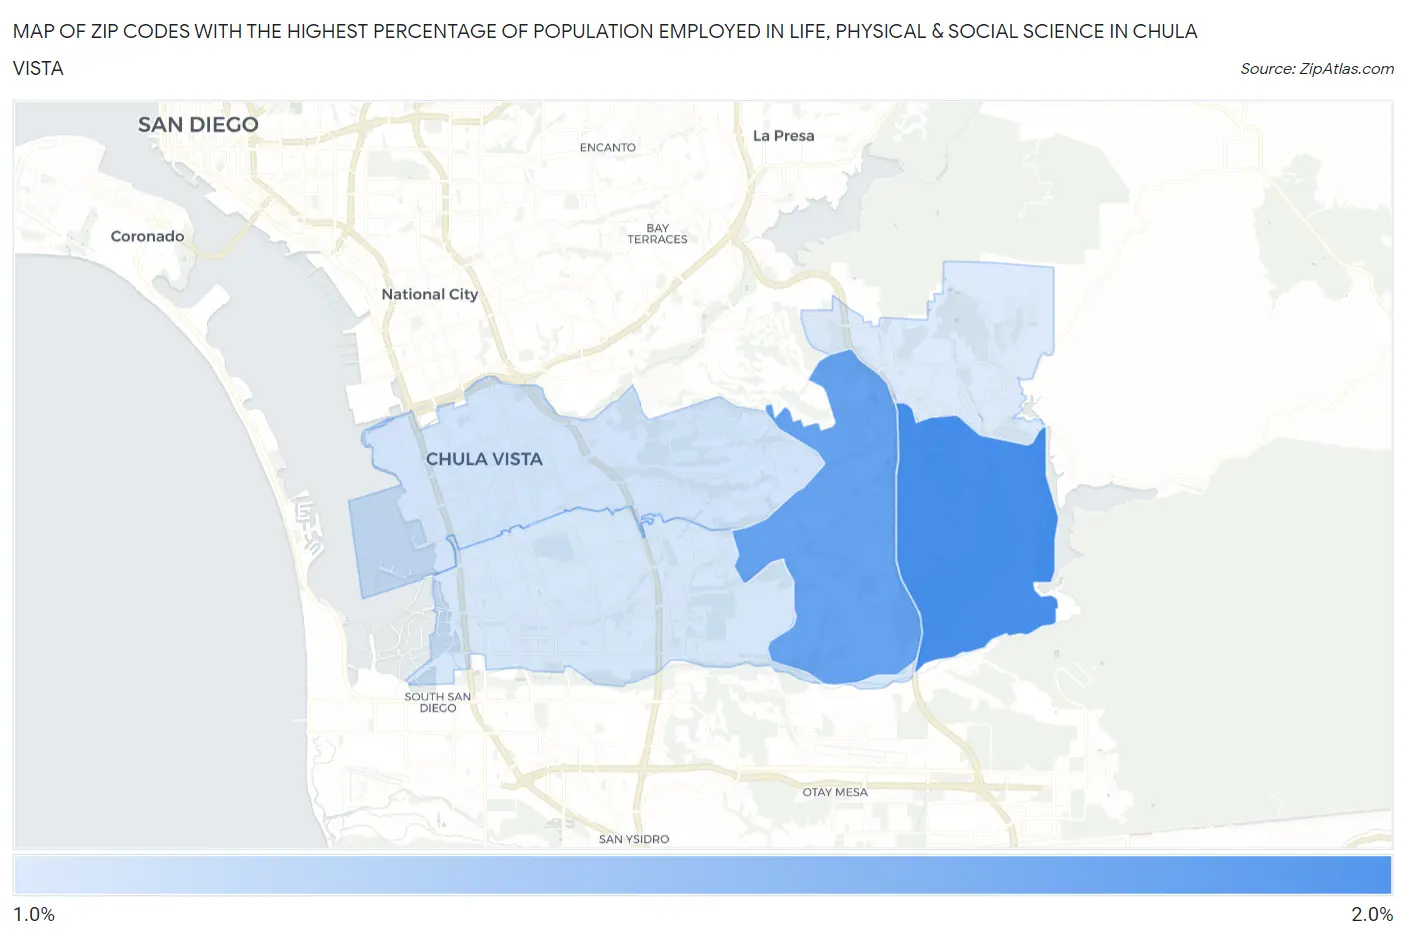
Zip Codes with the Highest Percentage of Population Employed in Life, Physical & Social Science in Chula Vista, CA
| Zip Code | % Employed | vs State | vs National | |
| 1. | 91915 | 1.8% | 1.3%(+0.494)#378 | 1.1%(+0.711)#4,313 |
| 2. | 91913 | 1.7% | 1.3%(+0.348)#426 | 1.1%(+0.565)#4,919 |
| 3. | 91910 | 1.1% | 1.3%(-0.191)#672 | 1.1%(+0.026)#8,094 |
| 4. | 91911 | 1.1% | 1.3%(-0.209)#689 | 1.1%(+0.008)#8,225 |
| 5. | 91914 | 1.1% | 1.3%(-0.244)#706 | 1.1%(-0.027)#8,521 |
1
Common Questions
What are the Top 3 Zip Codes with the Highest Percentage of Population Employed in Life, Physical & Social Science in Chula Vista, CA?
Top 3 Zip Codes with the Highest Percentage of Population Employed in Life, Physical & Social Science in Chula Vista, CA are:
What zip code has the Highest Percentage of Population Employed in Life, Physical & Social Science in Chula Vista, CA?
91915 has the Highest Percentage of Population Employed in Life, Physical & Social Science in Chula Vista, CA with 1.8%.
What is the Percentage of Population Employed in Life, Physical & Social Science in Chula Vista, CA?
Percentage of Population Employed in Life, Physical & Social Science in Chula Vista is 1.3%.
What is the Percentage of Population Employed in Life, Physical & Social Science in California?
Percentage of Population Employed in Life, Physical & Social Science in California is 1.3%.
What is the Percentage of Population Employed in Life, Physical & Social Science in the United States?
Percentage of Population Employed in Life, Physical & Social Science in the United States is 1.1%.