Zip Codes with the Highest Percentage of Population Employed in Life, Physical & Social Science in Manteca, CA
RELATED REPORTS & OPTIONS
Life, Physical & Social Science
Manteca
Compare Zip Codes
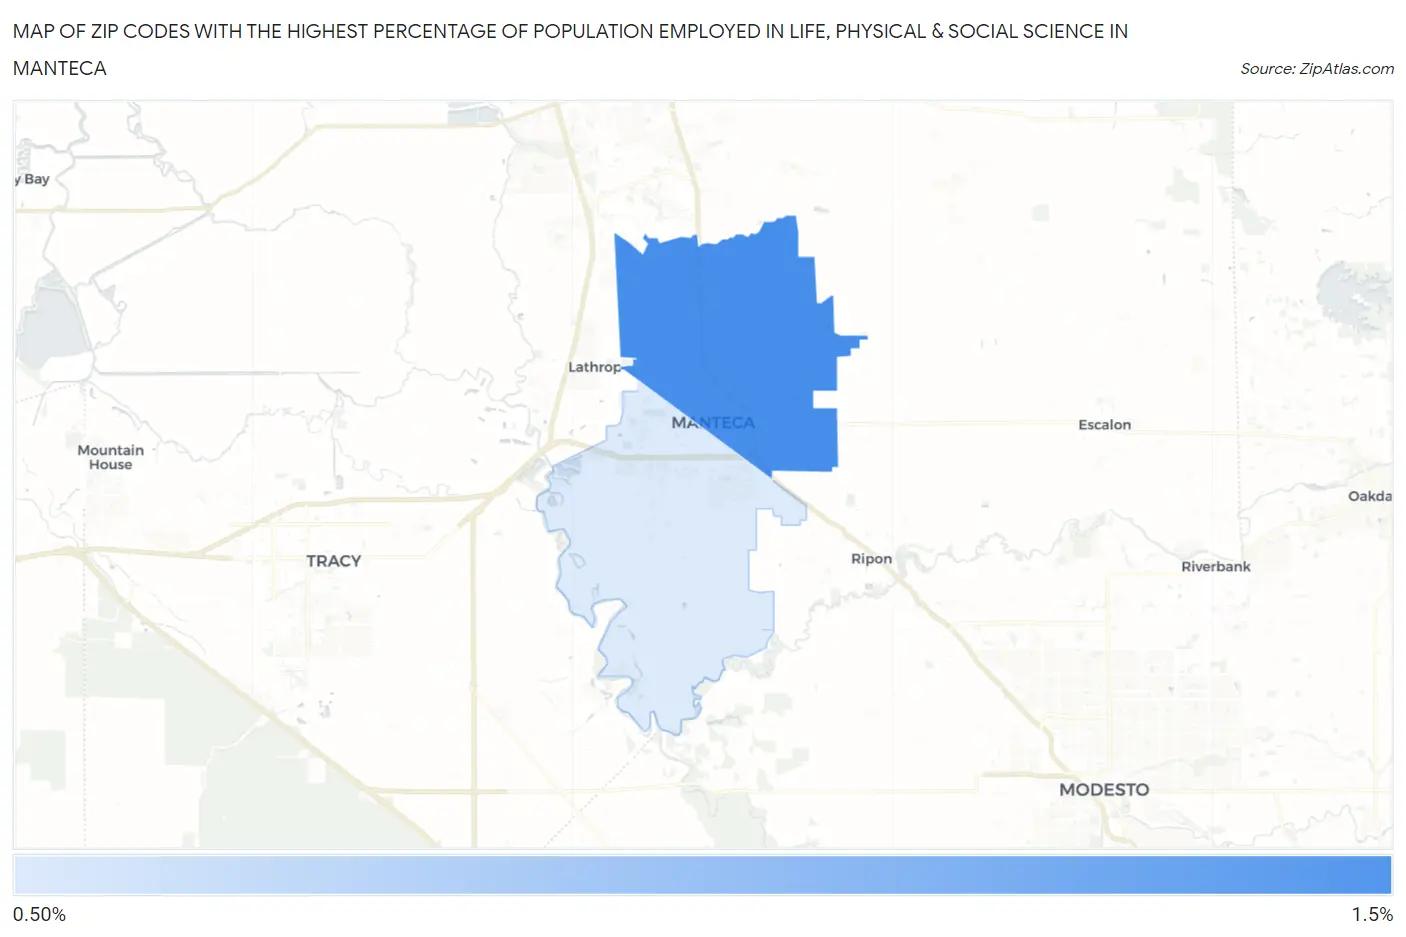
Map of Zip Codes with the Highest Percentage of Population Employed in Life, Physical & Social Science in Manteca
0.81%
1.2%
Zip Codes with the Highest Percentage of Population Employed in Life, Physical & Social Science in Manteca, CA
| Zip Code | % Employed | vs State | vs National | |
| 1. | 95336 | 1.2% | 1.3%(-0.060)#588 | 1.1%(+0.157)#7,149 |
| 2. | 95337 | 0.81% | 1.3%(-0.499)#874 | 1.1%(-0.282)#10,904 |
1
Common Questions
What are the Top Zip Codes with the Highest Percentage of Population Employed in Life, Physical & Social Science in Manteca, CA?
Top Zip Codes with the Highest Percentage of Population Employed in Life, Physical & Social Science in Manteca, CA are:
What zip code has the Highest Percentage of Population Employed in Life, Physical & Social Science in Manteca, CA?
95336 has the Highest Percentage of Population Employed in Life, Physical & Social Science in Manteca, CA with 1.2%.
What is the Percentage of Population Employed in Life, Physical & Social Science in Manteca, CA?
Percentage of Population Employed in Life, Physical & Social Science in Manteca is 1.0%.
What is the Percentage of Population Employed in Life, Physical & Social Science in California?
Percentage of Population Employed in Life, Physical & Social Science in California is 1.3%.
What is the Percentage of Population Employed in Life, Physical & Social Science in the United States?
Percentage of Population Employed in Life, Physical & Social Science in the United States is 1.1%.