Zip Codes with the Highest Percentage of Population Employed in Installation, Maintenance & Repair in Rancho Cordova, CA
RELATED REPORTS & OPTIONS
Installation, Maintenance & Repair
Rancho Cordova
Compare Zip Codes
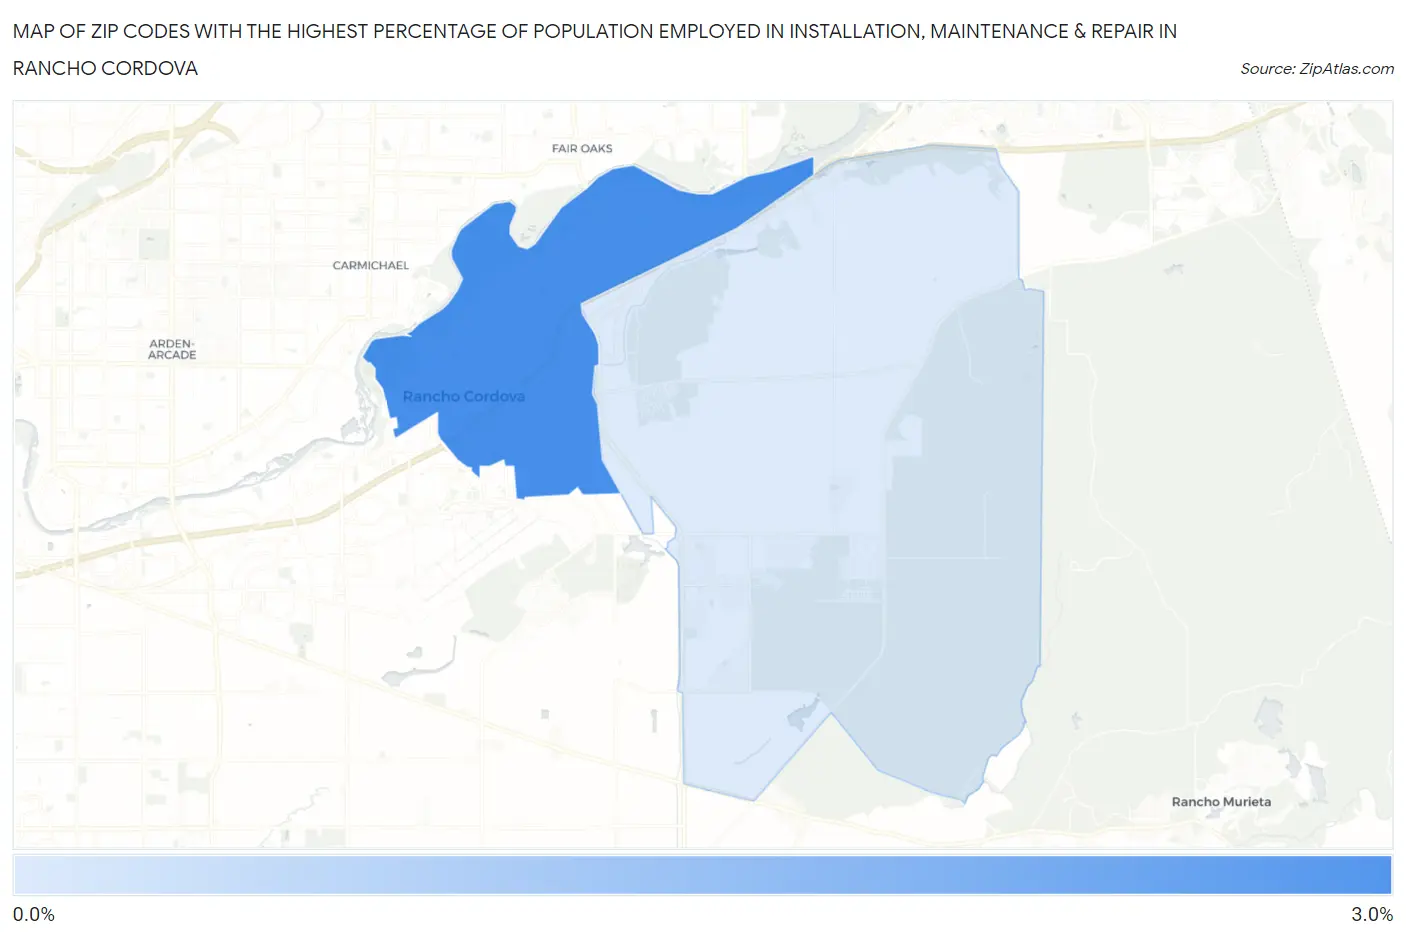
Map of Zip Codes with the Highest Percentage of Population Employed in Installation, Maintenance & Repair in Rancho Cordova
0.0%
3.0%
Zip Codes with the Highest Percentage of Population Employed in Installation, Maintenance & Repair in Rancho Cordova, CA
| Zip Code | % Employed | vs State | vs National | |
| 1. | 95670 | 2.5% | 2.6%(-0.025)#776 | 3.1%(-0.536)#19,399 |
| 2. | 95742 | 0.63% | 2.6%(-1.93)#1,346 | 3.1%(-2.44)#26,952 |
1
Common Questions
What are the Top Zip Codes with the Highest Percentage of Population Employed in Installation, Maintenance & Repair in Rancho Cordova, CA?
Top Zip Codes with the Highest Percentage of Population Employed in Installation, Maintenance & Repair in Rancho Cordova, CA are:
What zip code has the Highest Percentage of Population Employed in Installation, Maintenance & Repair in Rancho Cordova, CA?
95670 has the Highest Percentage of Population Employed in Installation, Maintenance & Repair in Rancho Cordova, CA with 2.5%.
What is the Percentage of Population Employed in Installation, Maintenance & Repair in Rancho Cordova, CA?
Percentage of Population Employed in Installation, Maintenance & Repair in Rancho Cordova is 2.6%.
What is the Percentage of Population Employed in Installation, Maintenance & Repair in California?
Percentage of Population Employed in Installation, Maintenance & Repair in California is 2.6%.
What is the Percentage of Population Employed in Installation, Maintenance & Repair in the United States?
Percentage of Population Employed in Installation, Maintenance & Repair in the United States is 3.1%.