Zip Codes with the Highest Percentage of Population Employed in Installation, Maintenance & Repair in San Francisco, CA
RELATED REPORTS & OPTIONS
Installation, Maintenance & Repair
San Francisco
Compare Zip Codes
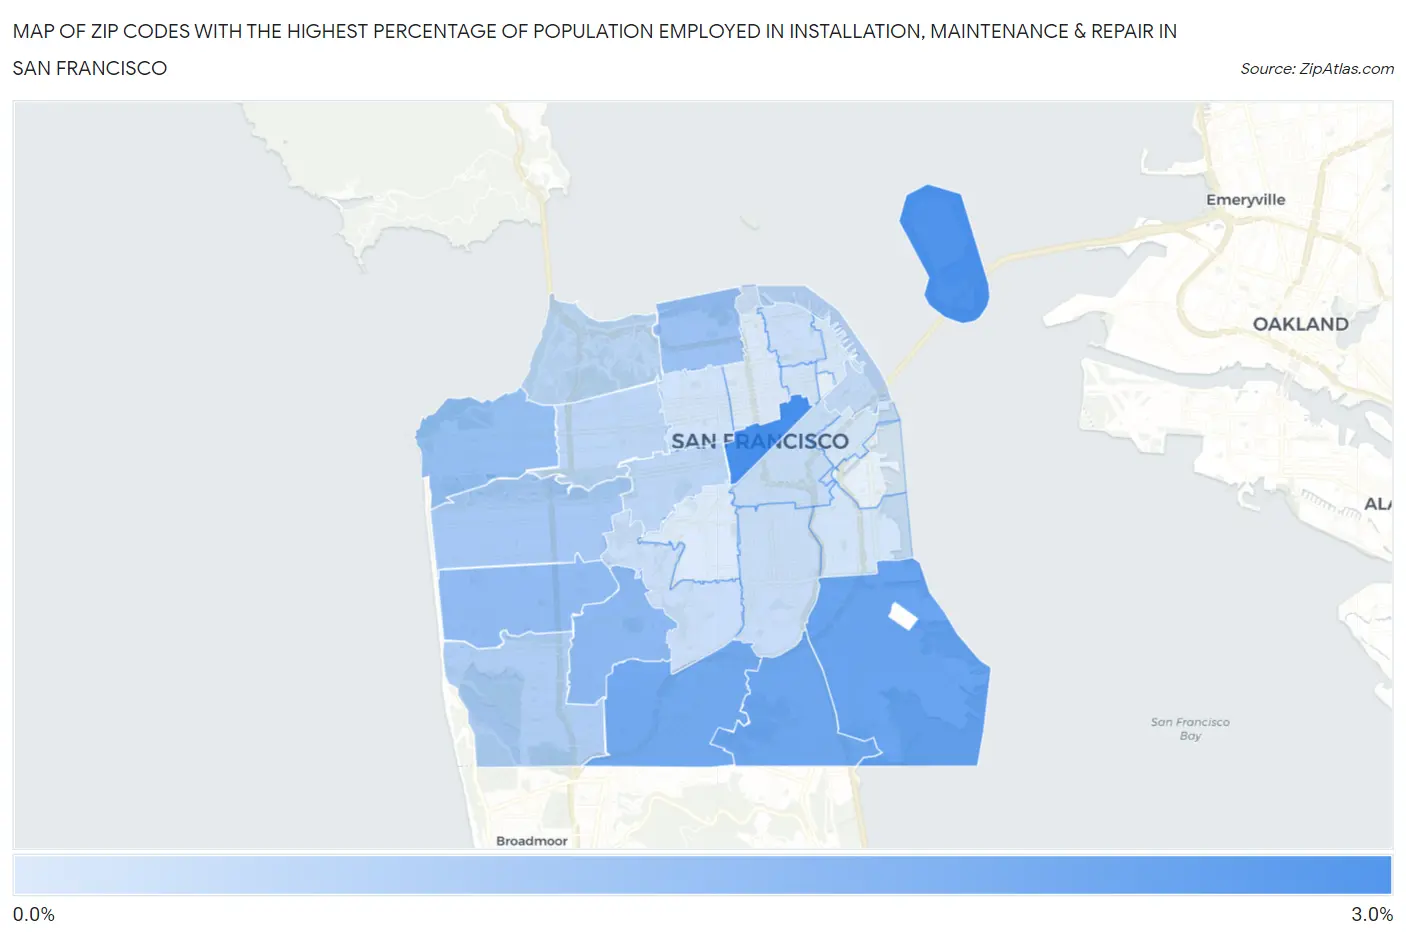
Map of Zip Codes with the Highest Percentage of Population Employed in Installation, Maintenance & Repair in San Francisco
0.20%
2.6%
Zip Codes with the Highest Percentage of Population Employed in Installation, Maintenance & Repair in San Francisco, CA
| Zip Code | % Employed | vs State | vs National | |
| 1. | 94102 | 2.6% | 2.6%(+0.074)#737 | 3.1%(-0.438)#18,934 |
| 2. | 94130 | 2.5% | 2.6%(-0.089)#804 | 3.1%(-0.601)#19,706 |
| 3. | 94124 | 2.1% | 2.6%(-0.475)#941 | 3.1%(-0.987)#21,632 |
| 4. | 94134 | 2.0% | 2.6%(-0.564)#979 | 3.1%(-1.08)#22,063 |
| 5. | 94112 | 1.9% | 2.6%(-0.662)#1,008 | 3.1%(-1.17)#22,488 |
| 6. | 94127 | 1.5% | 2.6%(-1.06)#1,122 | 3.1%(-1.57)#24,185 |
| 7. | 94116 | 1.4% | 2.6%(-1.13)#1,139 | 3.1%(-1.64)#24,459 |
| 8. | 94121 | 1.4% | 2.6%(-1.20)#1,157 | 3.1%(-1.71)#24,711 |
| 9. | 94123 | 1.2% | 2.6%(-1.31)#1,181 | 3.1%(-1.82)#25,083 |
| 10. | 94122 | 1.1% | 2.6%(-1.45)#1,222 | 3.1%(-1.96)#25,588 |
| 11. | 94132 | 0.94% | 2.6%(-1.62)#1,261 | 3.1%(-2.13)#26,077 |
| 12. | 94129 | 0.72% | 2.6%(-1.83)#1,320 | 3.1%(-2.34)#26,720 |
| 13. | 94117 | 0.72% | 2.6%(-1.84)#1,322 | 3.1%(-2.35)#26,724 |
| 14. | 94118 | 0.71% | 2.6%(-1.85)#1,325 | 3.1%(-2.36)#26,758 |
| 15. | 94105 | 0.66% | 2.6%(-1.90)#1,340 | 3.1%(-2.41)#26,888 |
| 16. | 94103 | 0.57% | 2.6%(-1.99)#1,356 | 3.1%(-2.50)#27,081 |
| 17. | 94110 | 0.53% | 2.6%(-2.03)#1,367 | 3.1%(-2.54)#27,154 |
| 18. | 94131 | 0.48% | 2.6%(-2.08)#1,380 | 3.1%(-2.59)#27,256 |
| 19. | 94133 | 0.48% | 2.6%(-2.08)#1,381 | 3.1%(-2.59)#27,258 |
| 20. | 94108 | 0.38% | 2.6%(-2.17)#1,397 | 3.1%(-2.68)#27,433 |
| 21. | 94115 | 0.36% | 2.6%(-2.19)#1,401 | 3.1%(-2.70)#27,463 |
| 22. | 94107 | 0.35% | 2.6%(-2.21)#1,407 | 3.1%(-2.72)#27,497 |
| 23. | 94111 | 0.31% | 2.6%(-2.25)#1,412 | 3.1%(-2.76)#27,541 |
| 24. | 94109 | 0.24% | 2.6%(-2.32)#1,425 | 3.1%(-2.83)#27,643 |
| 25. | 94114 | 0.20% | 2.6%(-2.36)#1,431 | 3.1%(-2.87)#27,687 |
1
Common Questions
What are the Top 10 Zip Codes with the Highest Percentage of Population Employed in Installation, Maintenance & Repair in San Francisco, CA?
Top 10 Zip Codes with the Highest Percentage of Population Employed in Installation, Maintenance & Repair in San Francisco, CA are:
What zip code has the Highest Percentage of Population Employed in Installation, Maintenance & Repair in San Francisco, CA?
94102 has the Highest Percentage of Population Employed in Installation, Maintenance & Repair in San Francisco, CA with 2.6%.
What is the Percentage of Population Employed in Installation, Maintenance & Repair in San Francisco, CA?
Percentage of Population Employed in Installation, Maintenance & Repair in San Francisco is 0.98%.
What is the Percentage of Population Employed in Installation, Maintenance & Repair in California?
Percentage of Population Employed in Installation, Maintenance & Repair in California is 2.6%.
What is the Percentage of Population Employed in Installation, Maintenance & Repair in the United States?
Percentage of Population Employed in Installation, Maintenance & Repair in the United States is 3.1%.