Zip Codes with the Highest Percentage of Population Employed in Installation, Maintenance & Repair in Perris, CA
RELATED REPORTS & OPTIONS
Installation, Maintenance & Repair
Perris
Compare Zip Codes
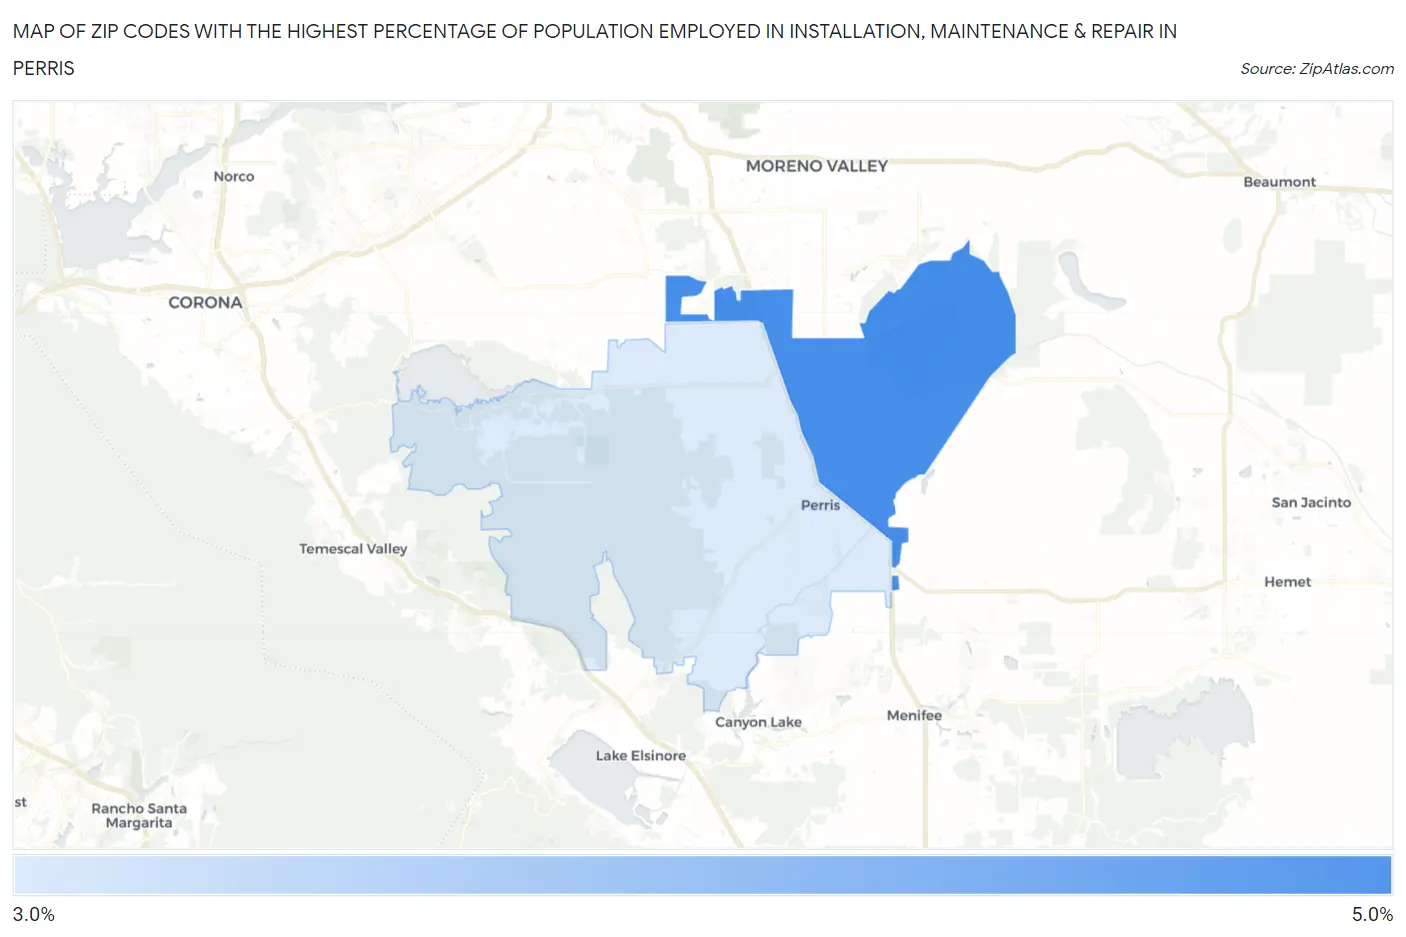
Map of Zip Codes with the Highest Percentage of Population Employed in Installation, Maintenance & Repair in Perris
3.9%
4.9%
Zip Codes with the Highest Percentage of Population Employed in Installation, Maintenance & Repair in Perris, CA
| Zip Code | % Employed | vs State | vs National | |
| 1. | 92571 | 4.9% | 2.6%(+2.33)#214 | 3.1%(+1.82)#9,095 |
| 2. | 92570 | 3.9% | 2.6%(+1.34)#360 | 3.1%(+0.830)#12,815 |
1
Common Questions
What are the Top Zip Codes with the Highest Percentage of Population Employed in Installation, Maintenance & Repair in Perris, CA?
Top Zip Codes with the Highest Percentage of Population Employed in Installation, Maintenance & Repair in Perris, CA are:
What zip code has the Highest Percentage of Population Employed in Installation, Maintenance & Repair in Perris, CA?
92571 has the Highest Percentage of Population Employed in Installation, Maintenance & Repair in Perris, CA with 4.9%.
What is the Percentage of Population Employed in Installation, Maintenance & Repair in Perris, CA?
Percentage of Population Employed in Installation, Maintenance & Repair in Perris is 4.5%.
What is the Percentage of Population Employed in Installation, Maintenance & Repair in California?
Percentage of Population Employed in Installation, Maintenance & Repair in California is 2.6%.
What is the Percentage of Population Employed in Installation, Maintenance & Repair in the United States?
Percentage of Population Employed in Installation, Maintenance & Repair in the United States is 3.1%.