Zip Codes with the Highest Percentage of Population Employed in Installation, Maintenance & Repair in Hemet, CA
RELATED REPORTS & OPTIONS
Installation, Maintenance & Repair
Hemet
Compare Zip Codes
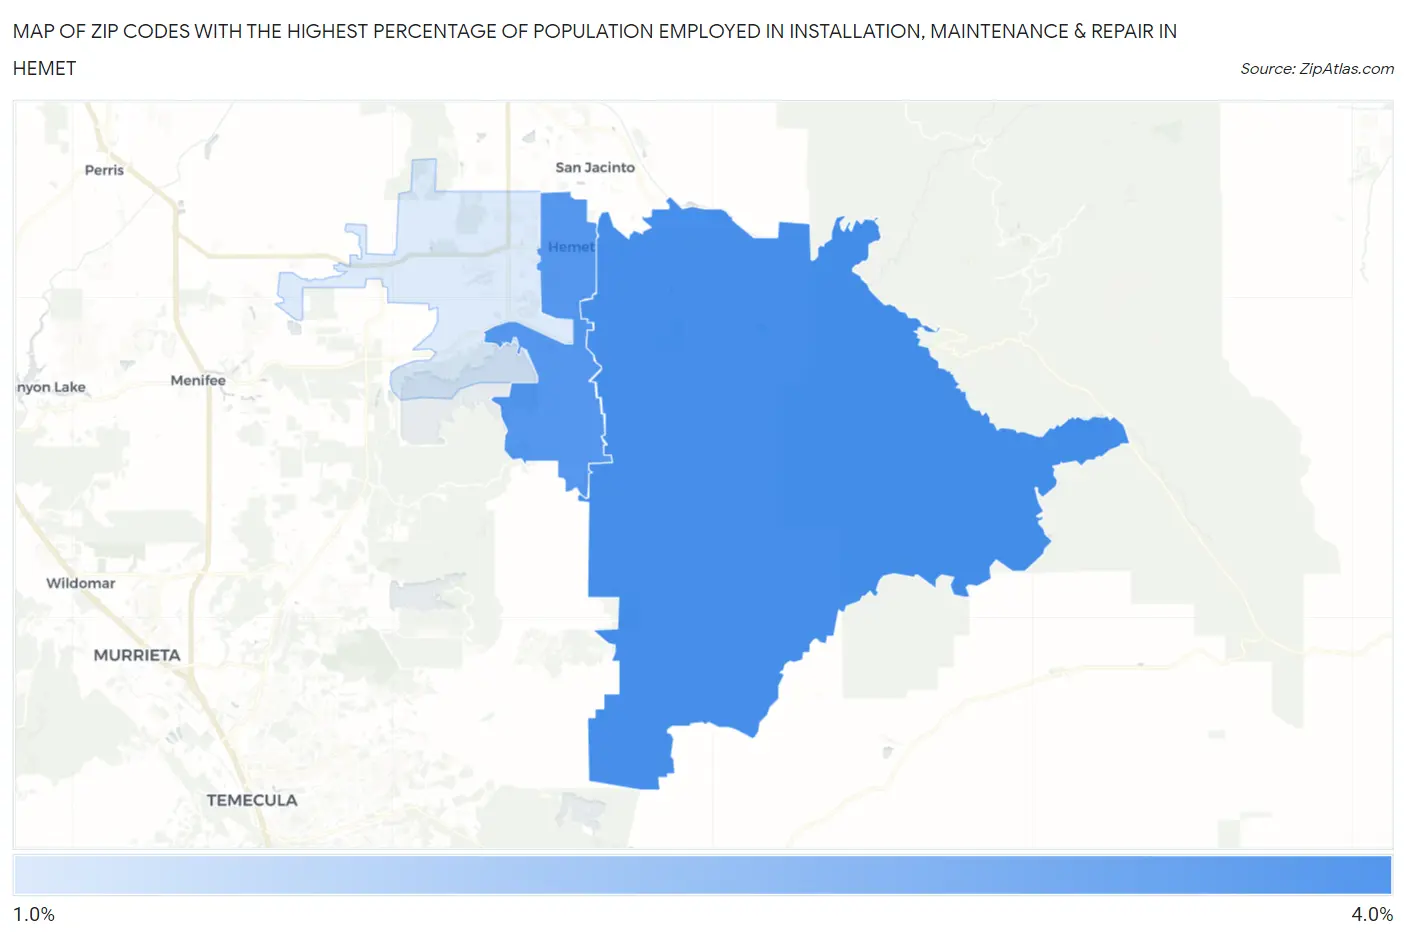
Map of Zip Codes with the Highest Percentage of Population Employed in Installation, Maintenance & Repair in Hemet
1.8%
3.6%
Zip Codes with the Highest Percentage of Population Employed in Installation, Maintenance & Repair in Hemet, CA
| Zip Code | % Employed | vs State | vs National | |
| 1. | 92544 | 3.6% | 2.6%(+0.998)#445 | 3.1%(+0.486)#14,361 |
| 2. | 92543 | 3.4% | 2.6%(+0.831)#479 | 3.1%(+0.320)#15,141 |
| 3. | 92545 | 1.8% | 2.6%(-0.769)#1,034 | 3.1%(-1.28)#22,952 |
1
Common Questions
What are the Top Zip Codes with the Highest Percentage of Population Employed in Installation, Maintenance & Repair in Hemet, CA?
Top Zip Codes with the Highest Percentage of Population Employed in Installation, Maintenance & Repair in Hemet, CA are:
What zip code has the Highest Percentage of Population Employed in Installation, Maintenance & Repair in Hemet, CA?
92544 has the Highest Percentage of Population Employed in Installation, Maintenance & Repair in Hemet, CA with 3.6%.
What is the Percentage of Population Employed in Installation, Maintenance & Repair in Hemet, CA?
Percentage of Population Employed in Installation, Maintenance & Repair in Hemet is 2.7%.
What is the Percentage of Population Employed in Installation, Maintenance & Repair in California?
Percentage of Population Employed in Installation, Maintenance & Repair in California is 2.6%.
What is the Percentage of Population Employed in Installation, Maintenance & Repair in the United States?
Percentage of Population Employed in Installation, Maintenance & Repair in the United States is 3.1%.