Zip Codes with the Highest Percentage of Population Employed in Installation, Maintenance & Repair in Tustin, CA
RELATED REPORTS & OPTIONS
Installation, Maintenance & Repair
Tustin
Compare Zip Codes
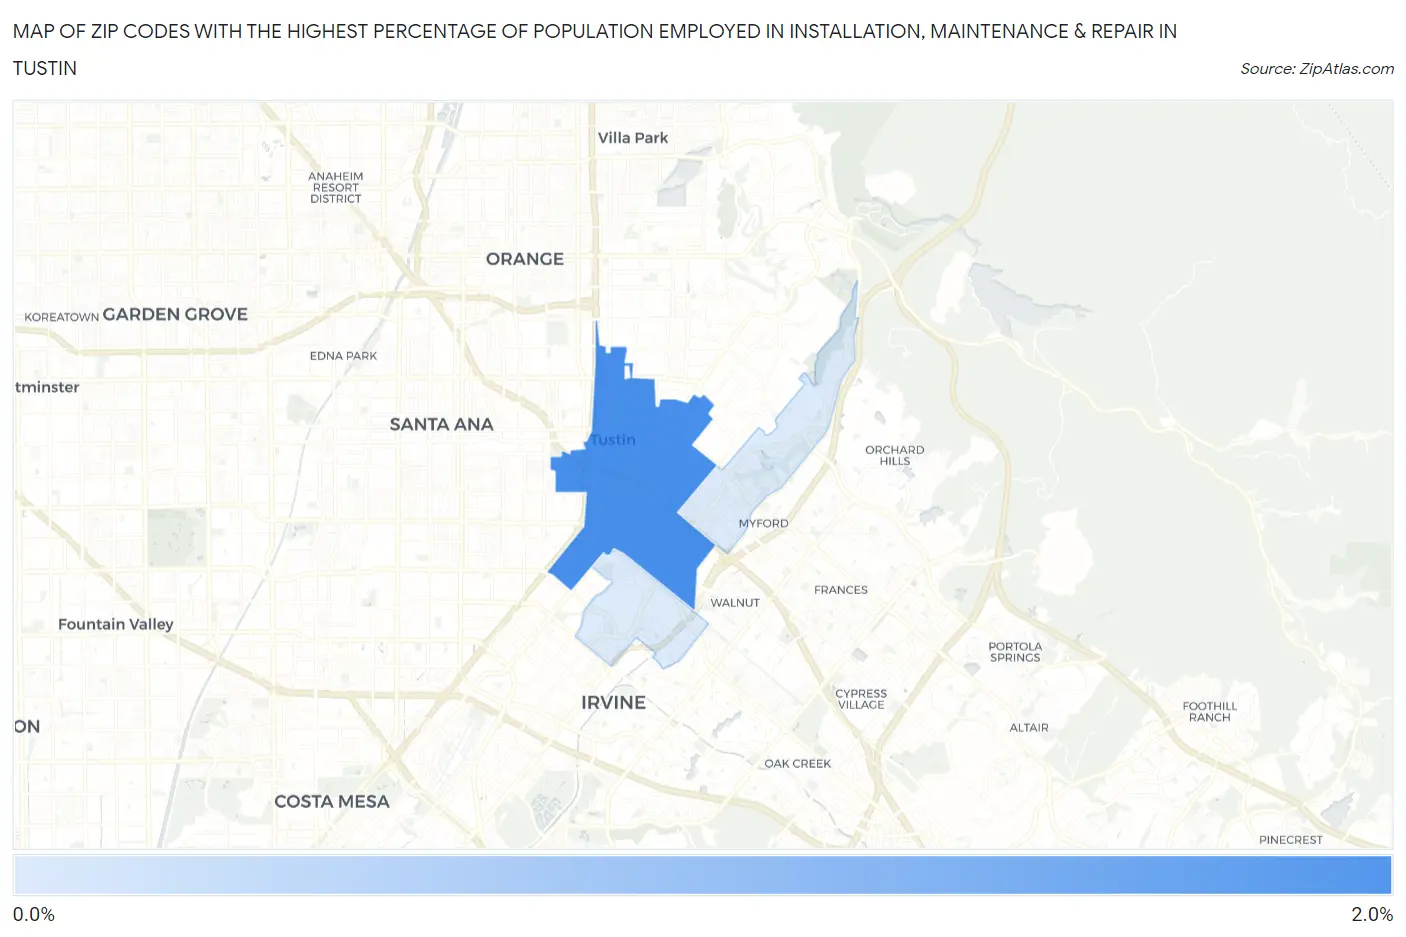
Map of Zip Codes with the Highest Percentage of Population Employed in Installation, Maintenance & Repair in Tustin
0.74%
1.9%
Zip Codes with the Highest Percentage of Population Employed in Installation, Maintenance & Repair in Tustin, CA
| Zip Code | % Employed | vs State | vs National | |
| 1. | 92780 | 1.9% | 2.6%(-0.646)#1,003 | 3.1%(-1.16)#22,425 |
| 2. | 92782 | 0.74% | 2.6%(-1.82)#1,314 | 3.1%(-2.33)#26,672 |
1
Common Questions
What are the Top Zip Codes with the Highest Percentage of Population Employed in Installation, Maintenance & Repair in Tustin, CA?
Top Zip Codes with the Highest Percentage of Population Employed in Installation, Maintenance & Repair in Tustin, CA are:
What zip code has the Highest Percentage of Population Employed in Installation, Maintenance & Repair in Tustin, CA?
92780 has the Highest Percentage of Population Employed in Installation, Maintenance & Repair in Tustin, CA with 1.9%.
What is the Percentage of Population Employed in Installation, Maintenance & Repair in Tustin, CA?
Percentage of Population Employed in Installation, Maintenance & Repair in Tustin is 1.5%.
What is the Percentage of Population Employed in Installation, Maintenance & Repair in California?
Percentage of Population Employed in Installation, Maintenance & Repair in California is 2.6%.
What is the Percentage of Population Employed in Installation, Maintenance & Repair in the United States?
Percentage of Population Employed in Installation, Maintenance & Repair in the United States is 3.1%.