Zip Codes with the Highest Percentage of Population Employed in Installation, Maintenance & Repair in San Marcos, CA
RELATED REPORTS & OPTIONS
Installation, Maintenance & Repair
San Marcos
Compare Zip Codes
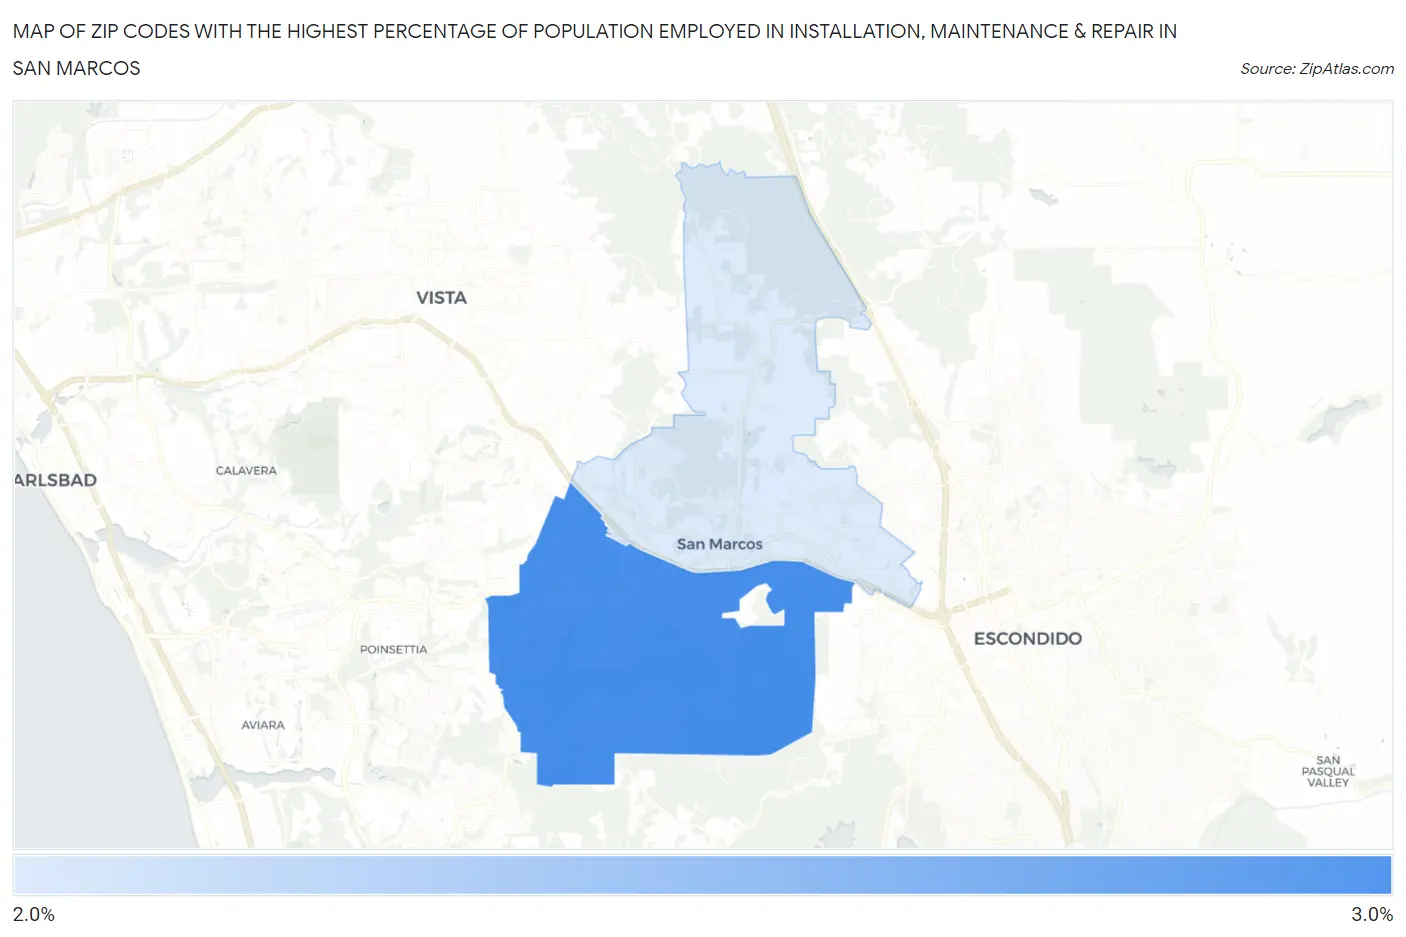
Map of Zip Codes with the Highest Percentage of Population Employed in Installation, Maintenance & Repair in San Marcos
2.5%
2.5%
Zip Codes with the Highest Percentage of Population Employed in Installation, Maintenance & Repair in San Marcos, CA
| Zip Code | % Employed | vs State | vs National | |
| 1. | 92078 | 2.5% | 2.6%(-0.034)#779 | 3.1%(-0.546)#19,439 |
| 2. | 92069 | 2.5% | 2.6%(-0.083)#801 | 3.1%(-0.595)#19,672 |
1
Common Questions
What are the Top Zip Codes with the Highest Percentage of Population Employed in Installation, Maintenance & Repair in San Marcos, CA?
Top Zip Codes with the Highest Percentage of Population Employed in Installation, Maintenance & Repair in San Marcos, CA are:
What zip code has the Highest Percentage of Population Employed in Installation, Maintenance & Repair in San Marcos, CA?
92078 has the Highest Percentage of Population Employed in Installation, Maintenance & Repair in San Marcos, CA with 2.5%.
What is the Percentage of Population Employed in Installation, Maintenance & Repair in San Marcos, CA?
Percentage of Population Employed in Installation, Maintenance & Repair in San Marcos is 2.4%.
What is the Percentage of Population Employed in Installation, Maintenance & Repair in California?
Percentage of Population Employed in Installation, Maintenance & Repair in California is 2.6%.
What is the Percentage of Population Employed in Installation, Maintenance & Repair in the United States?
Percentage of Population Employed in Installation, Maintenance & Repair in the United States is 3.1%.