Zip Codes with the Highest Percentage of Population Employed in Installation, Maintenance & Repair in Eureka, CA
RELATED REPORTS & OPTIONS
Installation, Maintenance & Repair
Eureka
Compare Zip Codes
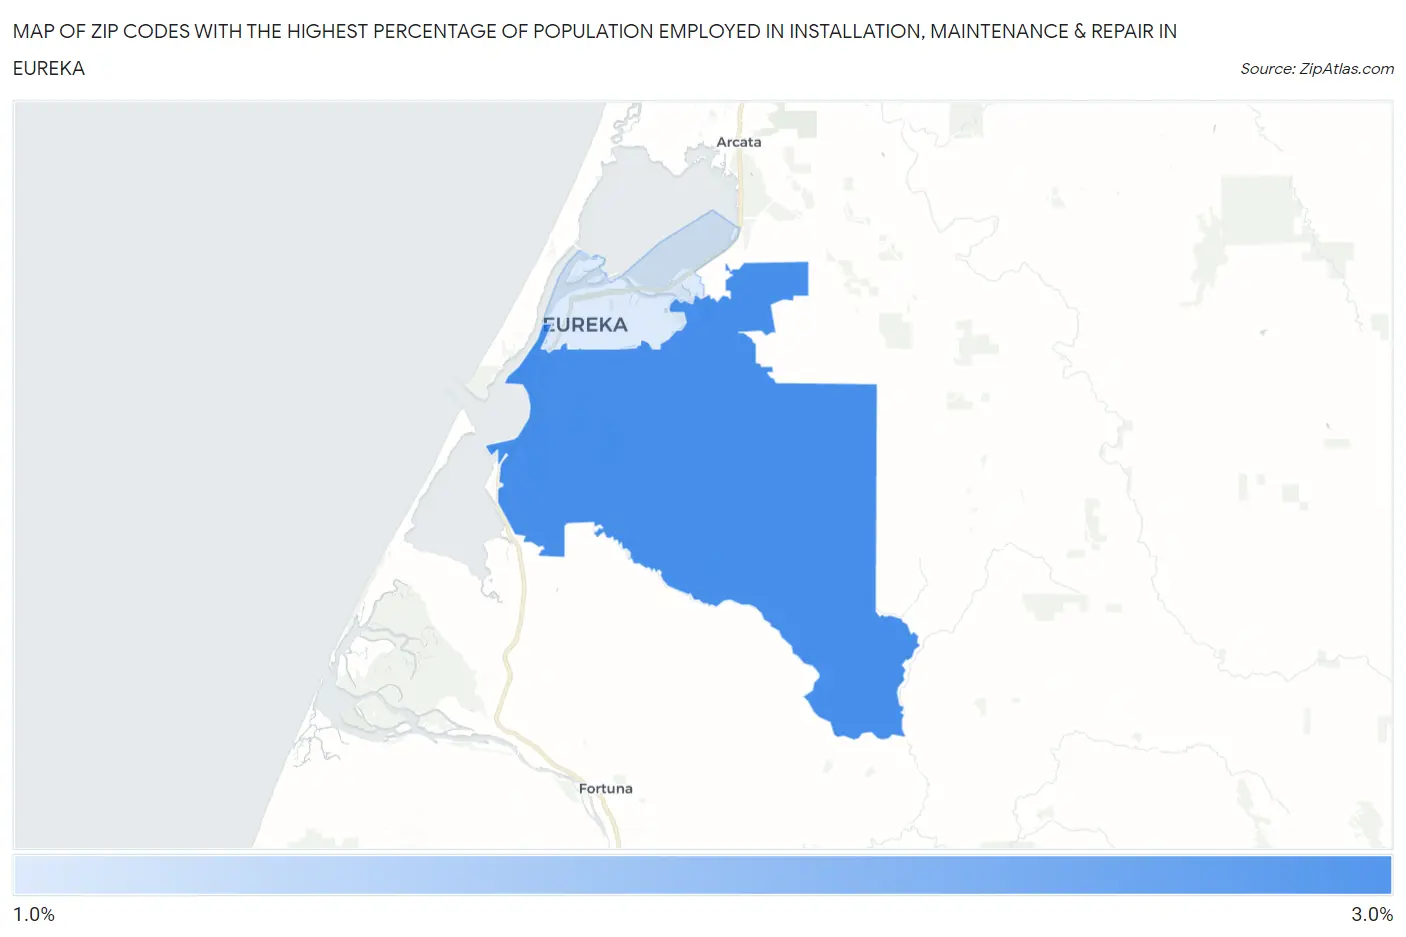
Map of Zip Codes with the Highest Percentage of Population Employed in Installation, Maintenance & Repair in Eureka
1.6%
2.8%
Zip Codes with the Highest Percentage of Population Employed in Installation, Maintenance & Repair in Eureka, CA
| Zip Code | % Employed | vs State | vs National | |
| 1. | 95503 | 2.8% | 2.6%(+0.221)#678 | 3.1%(-0.291)#18,128 |
| 2. | 95501 | 1.6% | 2.6%(-0.951)#1,095 | 3.1%(-1.46)#23,740 |
1
Common Questions
What are the Top Zip Codes with the Highest Percentage of Population Employed in Installation, Maintenance & Repair in Eureka, CA?
Top Zip Codes with the Highest Percentage of Population Employed in Installation, Maintenance & Repair in Eureka, CA are:
What zip code has the Highest Percentage of Population Employed in Installation, Maintenance & Repair in Eureka, CA?
95503 has the Highest Percentage of Population Employed in Installation, Maintenance & Repair in Eureka, CA with 2.8%.
What is the Percentage of Population Employed in Installation, Maintenance & Repair in Eureka, CA?
Percentage of Population Employed in Installation, Maintenance & Repair in Eureka is 1.2%.
What is the Percentage of Population Employed in Installation, Maintenance & Repair in California?
Percentage of Population Employed in Installation, Maintenance & Repair in California is 2.6%.
What is the Percentage of Population Employed in Installation, Maintenance & Repair in the United States?
Percentage of Population Employed in Installation, Maintenance & Repair in the United States is 3.1%.