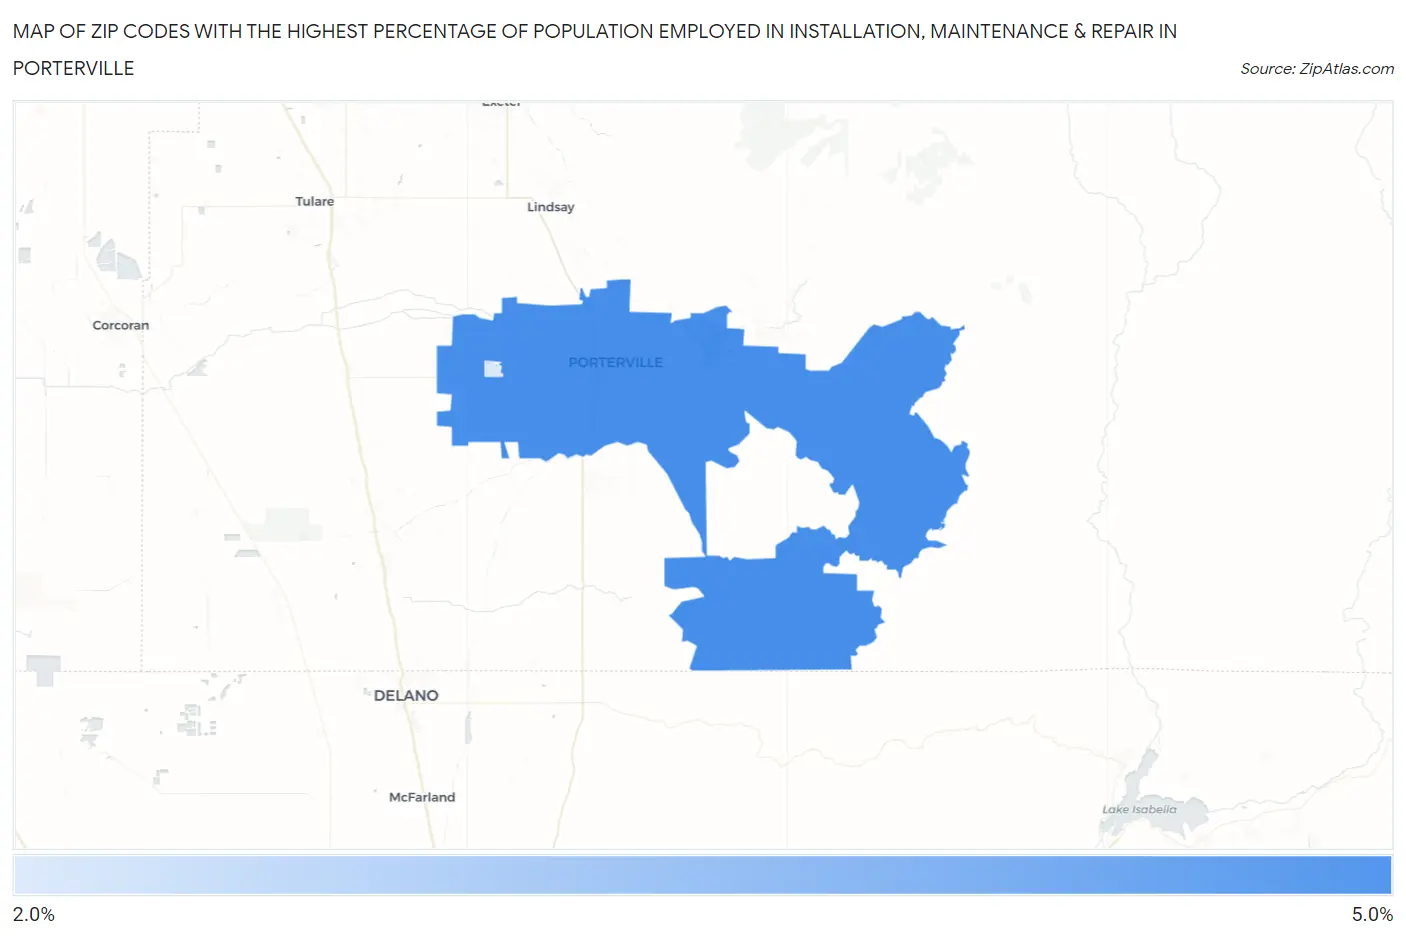
Zip Codes with the Highest Percentage of Population Employed in Installation, Maintenance & Repair in Porterville, CA
RELATED REPORTS & OPTIONS
Installation, Maintenance & Repair
Porterville
Compare Zip Codes
Map of Zip Codes with the Highest Percentage of Population Employed in Installation, Maintenance & Repair in Porterville
2.2%
4.2%
Zip Codes with the Highest Percentage of Population Employed in Installation, Maintenance & Repair in Porterville, CA
| Zip Code | % Employed | vs State | vs National | |
| 1. | 93257 | 4.2% | 2.6%(+1.60)#300 | 3.1%(+1.09)#11,712 |
| 2. | 93258 | 2.2% | 2.6%(-0.314)#893 | 3.1%(-0.825)#20,866 |
1
Common Questions
What are the Top Zip Codes with the Highest Percentage of Population Employed in Installation, Maintenance & Repair in Porterville, CA?
Top Zip Codes with the Highest Percentage of Population Employed in Installation, Maintenance & Repair in Porterville, CA are:
What zip code has the Highest Percentage of Population Employed in Installation, Maintenance & Repair in Porterville, CA?
93257 has the Highest Percentage of Population Employed in Installation, Maintenance & Repair in Porterville, CA with 4.2%.
What is the Percentage of Population Employed in Installation, Maintenance & Repair in Porterville, CA?
Percentage of Population Employed in Installation, Maintenance & Repair in Porterville is 3.5%.
What is the Percentage of Population Employed in Installation, Maintenance & Repair in California?
Percentage of Population Employed in Installation, Maintenance & Repair in California is 2.6%.
What is the Percentage of Population Employed in Installation, Maintenance & Repair in the United States?
Percentage of Population Employed in Installation, Maintenance & Repair in the United States is 3.1%.