Zip Codes with the Highest Percentage of Population Employed in Real Estate, Rental & Leasing in Rancho Cordova, CA
RELATED REPORTS & OPTIONS
Real Estate, Rental & Leasing
Rancho Cordova
Compare Zip Codes
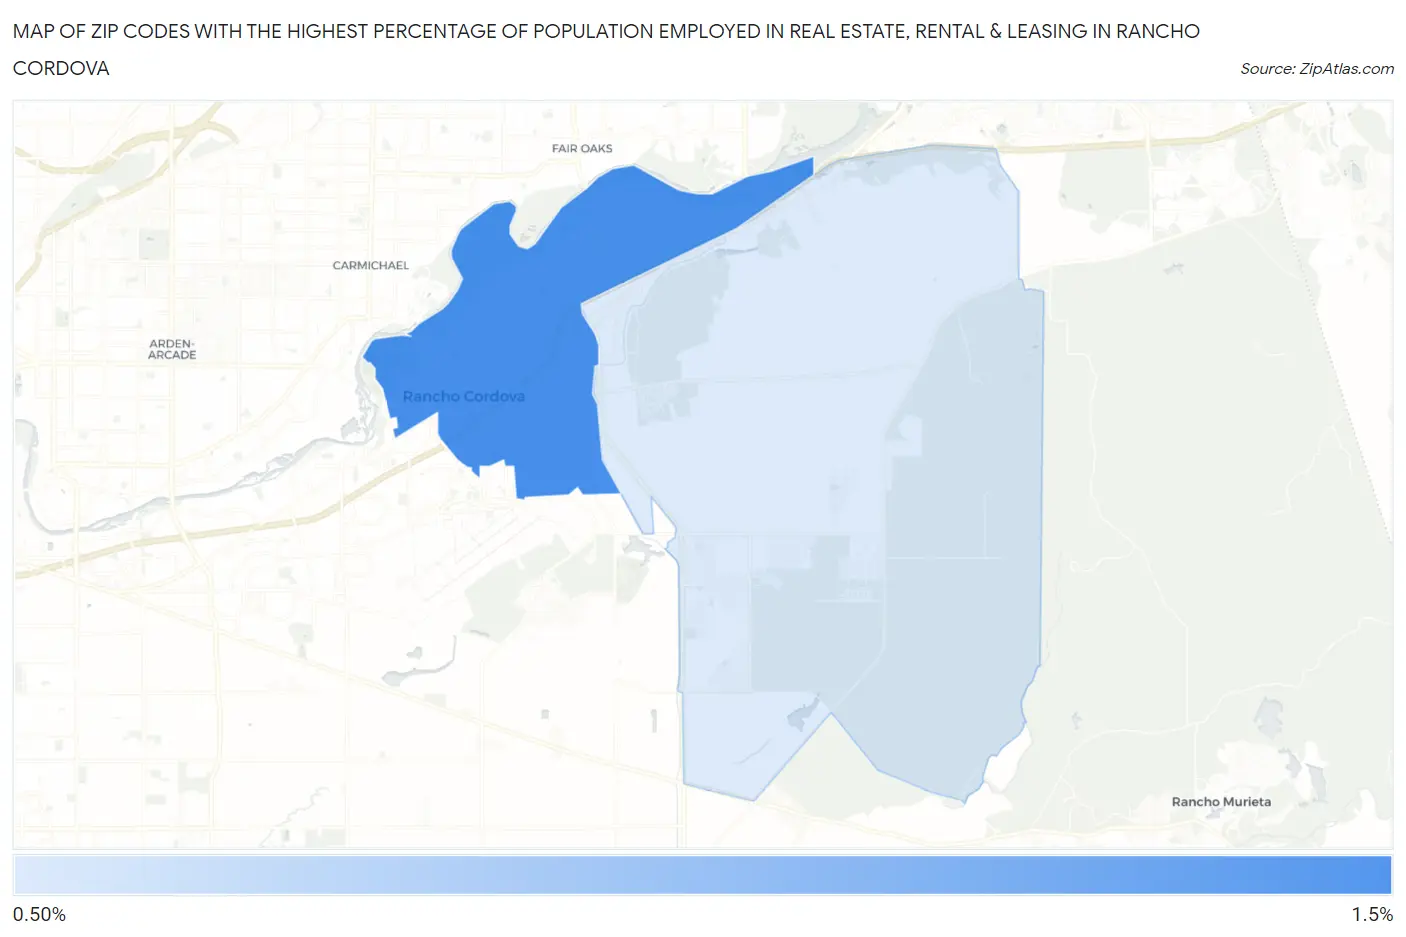
Map of Zip Codes with the Highest Percentage of Population Employed in Real Estate, Rental & Leasing in Rancho Cordova
0.56%
1.5%
Zip Codes with the Highest Percentage of Population Employed in Real Estate, Rental & Leasing in Rancho Cordova, CA
| Zip Code | % Employed | vs State | vs National | |
| 1. | 95670 | 1.5% | 2.1%(-0.644)#955 | 1.9%(-0.416)#11,356 |
| 2. | 95742 | 0.56% | 2.1%(-1.56)#1,299 | 1.9%(-1.33)#18,603 |
1
Common Questions
What are the Top Zip Codes with the Highest Percentage of Population Employed in Real Estate, Rental & Leasing in Rancho Cordova, CA?
Top Zip Codes with the Highest Percentage of Population Employed in Real Estate, Rental & Leasing in Rancho Cordova, CA are:
What zip code has the Highest Percentage of Population Employed in Real Estate, Rental & Leasing in Rancho Cordova, CA?
95670 has the Highest Percentage of Population Employed in Real Estate, Rental & Leasing in Rancho Cordova, CA with 1.5%.
What is the Percentage of Population Employed in Real Estate, Rental & Leasing in Rancho Cordova, CA?
Percentage of Population Employed in Real Estate, Rental & Leasing in Rancho Cordova is 1.2%.
What is the Percentage of Population Employed in Real Estate, Rental & Leasing in California?
Percentage of Population Employed in Real Estate, Rental & Leasing in California is 2.1%.
What is the Percentage of Population Employed in Real Estate, Rental & Leasing in the United States?
Percentage of Population Employed in Real Estate, Rental & Leasing in the United States is 1.9%.