Zip Codes with the Highest Percentage of Population Employed in Food Preparation & Serving in Rancho Cordova, CA
RELATED REPORTS & OPTIONS
Food Preparation & Serving
Rancho Cordova
Compare Zip Codes
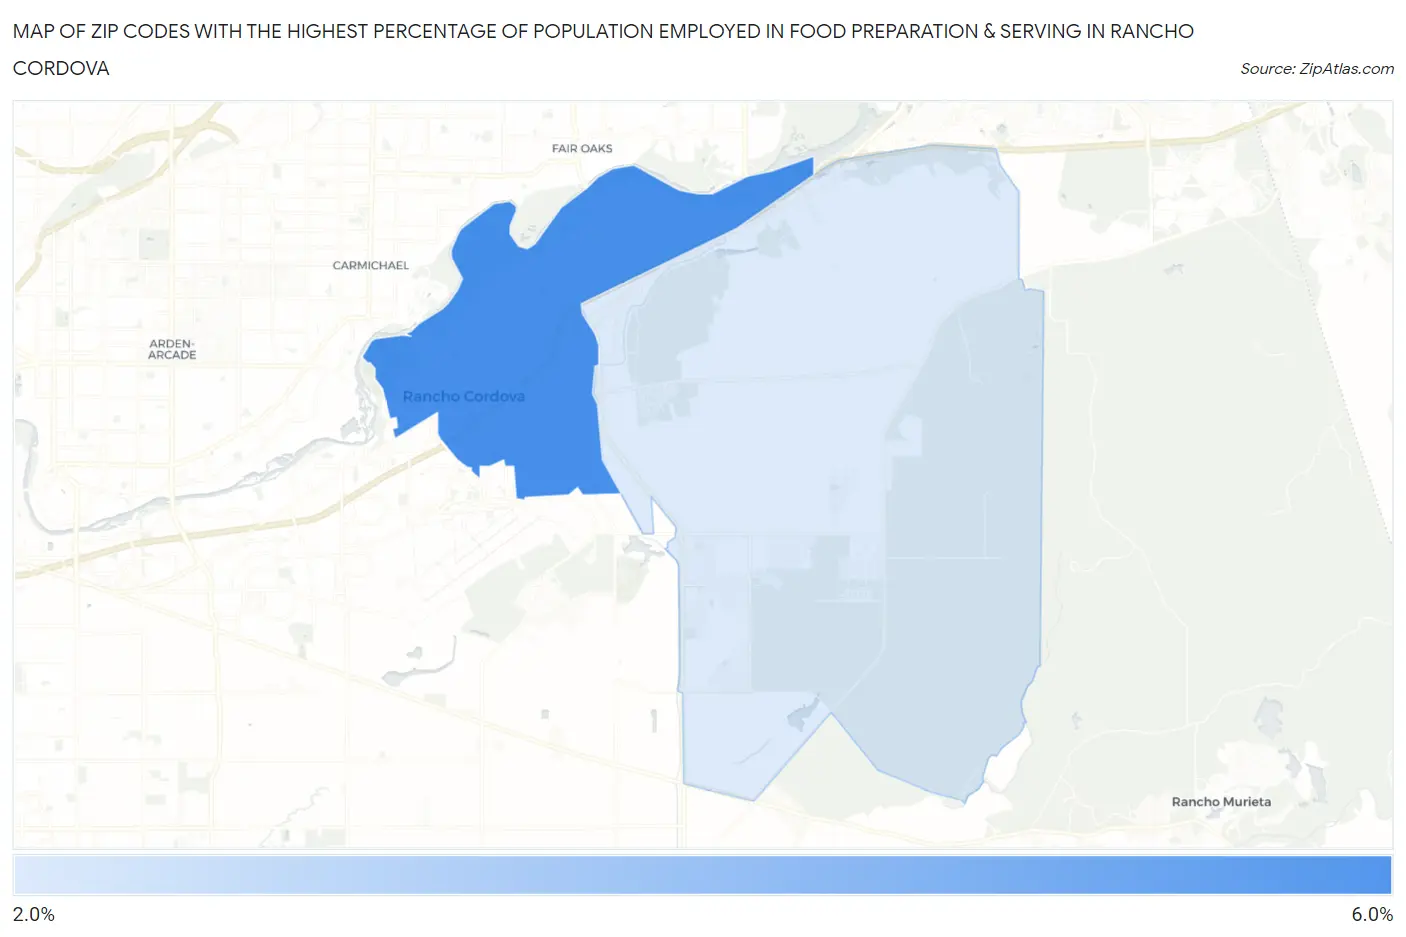
Map of Zip Codes with the Highest Percentage of Population Employed in Food Preparation & Serving in Rancho Cordova
2.4%
5.0%
Zip Codes with the Highest Percentage of Population Employed in Food Preparation & Serving in Rancho Cordova, CA
| Zip Code | % Employed | vs State | vs National | |
| 1. | 95670 | 5.0% | 5.4%(-0.342)#772 | 5.3%(-0.245)#12,780 |
| 2. | 95742 | 2.4% | 5.4%(-2.98)#1,326 | 5.3%(-2.88)#23,449 |
1
Common Questions
What are the Top Zip Codes with the Highest Percentage of Population Employed in Food Preparation & Serving in Rancho Cordova, CA?
Top Zip Codes with the Highest Percentage of Population Employed in Food Preparation & Serving in Rancho Cordova, CA are:
What zip code has the Highest Percentage of Population Employed in Food Preparation & Serving in Rancho Cordova, CA?
95670 has the Highest Percentage of Population Employed in Food Preparation & Serving in Rancho Cordova, CA with 5.0%.
What is the Percentage of Population Employed in Food Preparation & Serving in Rancho Cordova, CA?
Percentage of Population Employed in Food Preparation & Serving in Rancho Cordova is 5.3%.
What is the Percentage of Population Employed in Food Preparation & Serving in California?
Percentage of Population Employed in Food Preparation & Serving in California is 5.4%.
What is the Percentage of Population Employed in Food Preparation & Serving in the United States?
Percentage of Population Employed in Food Preparation & Serving in the United States is 5.3%.