Zip Codes with the Highest Percentage of Population Employed in Office & Administration in Rancho Cordova, CA
RELATED REPORTS & OPTIONS
Office & Administration
Rancho Cordova
Compare Zip Codes
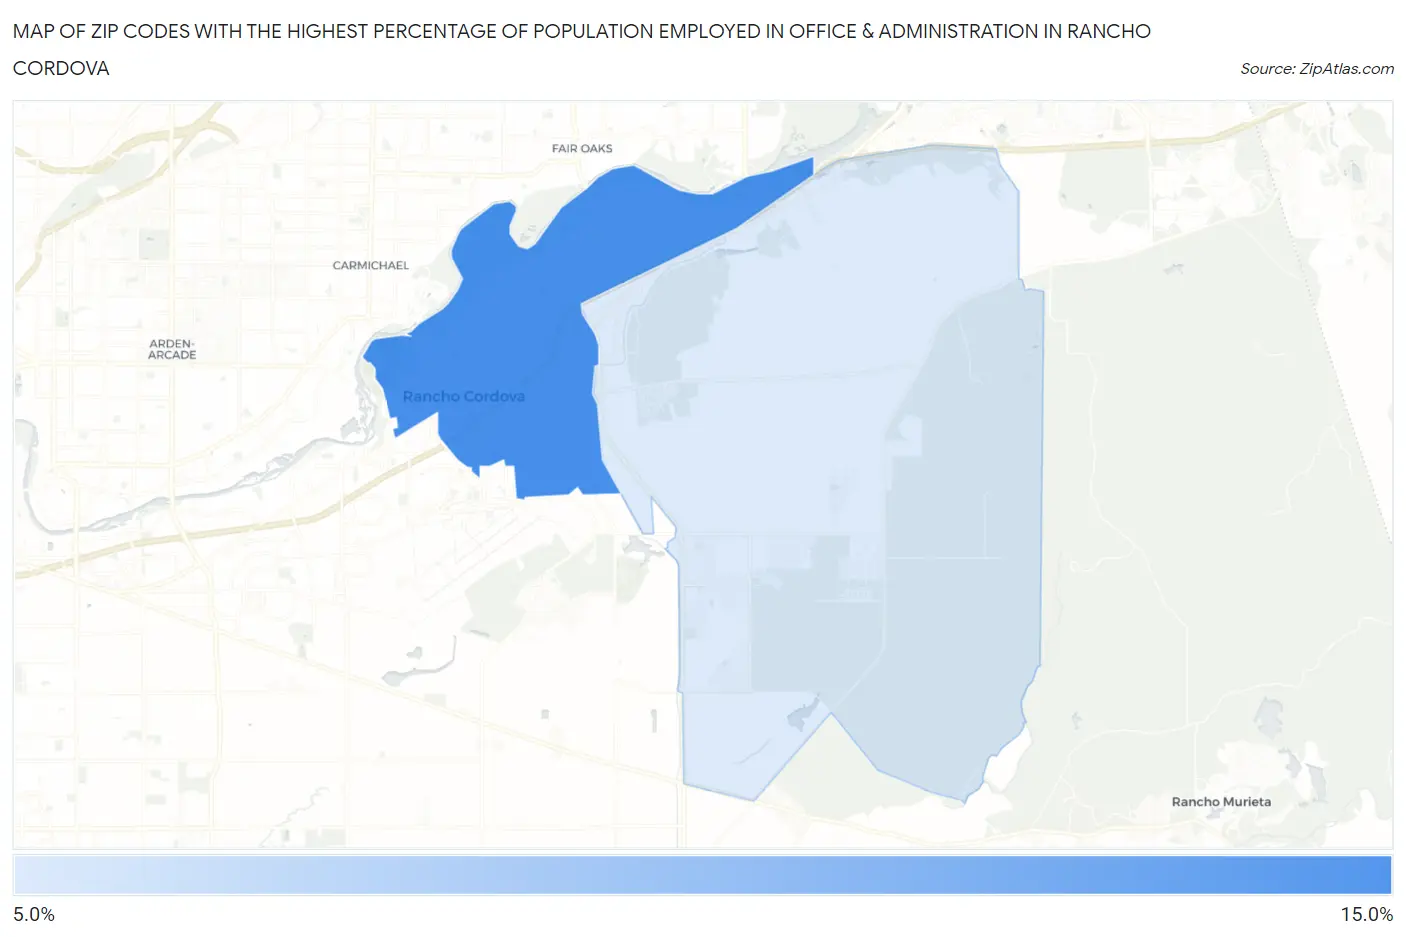
Map of Zip Codes with the Highest Percentage of Population Employed in Office & Administration in Rancho Cordova
12.7%
14.9%
Zip Codes with the Highest Percentage of Population Employed in Office & Administration in Rancho Cordova, CA
| Zip Code | % Employed | vs State | vs National | |
| 1. | 95670 | 14.9% | 10.5%(+4.35)#157 | 10.9%(+4.00)#4,759 |
| 2. | 95742 | 12.7% | 10.5%(+2.18)#359 | 10.9%(+1.83)#8,824 |
1
Common Questions
What are the Top Zip Codes with the Highest Percentage of Population Employed in Office & Administration in Rancho Cordova, CA?
Top Zip Codes with the Highest Percentage of Population Employed in Office & Administration in Rancho Cordova, CA are:
What zip code has the Highest Percentage of Population Employed in Office & Administration in Rancho Cordova, CA?
95670 has the Highest Percentage of Population Employed in Office & Administration in Rancho Cordova, CA with 14.9%.
What is the Percentage of Population Employed in Office & Administration in Rancho Cordova, CA?
Percentage of Population Employed in Office & Administration in Rancho Cordova is 15.3%.
What is the Percentage of Population Employed in Office & Administration in California?
Percentage of Population Employed in Office & Administration in California is 10.5%.
What is the Percentage of Population Employed in Office & Administration in the United States?
Percentage of Population Employed in Office & Administration in the United States is 10.9%.