Zip Codes with the Highest Percentage of Population Employed in Installation, Maintenance & Repair in San Jacinto, CA
RELATED REPORTS & OPTIONS
Installation, Maintenance & Repair
San Jacinto
Compare Zip Codes
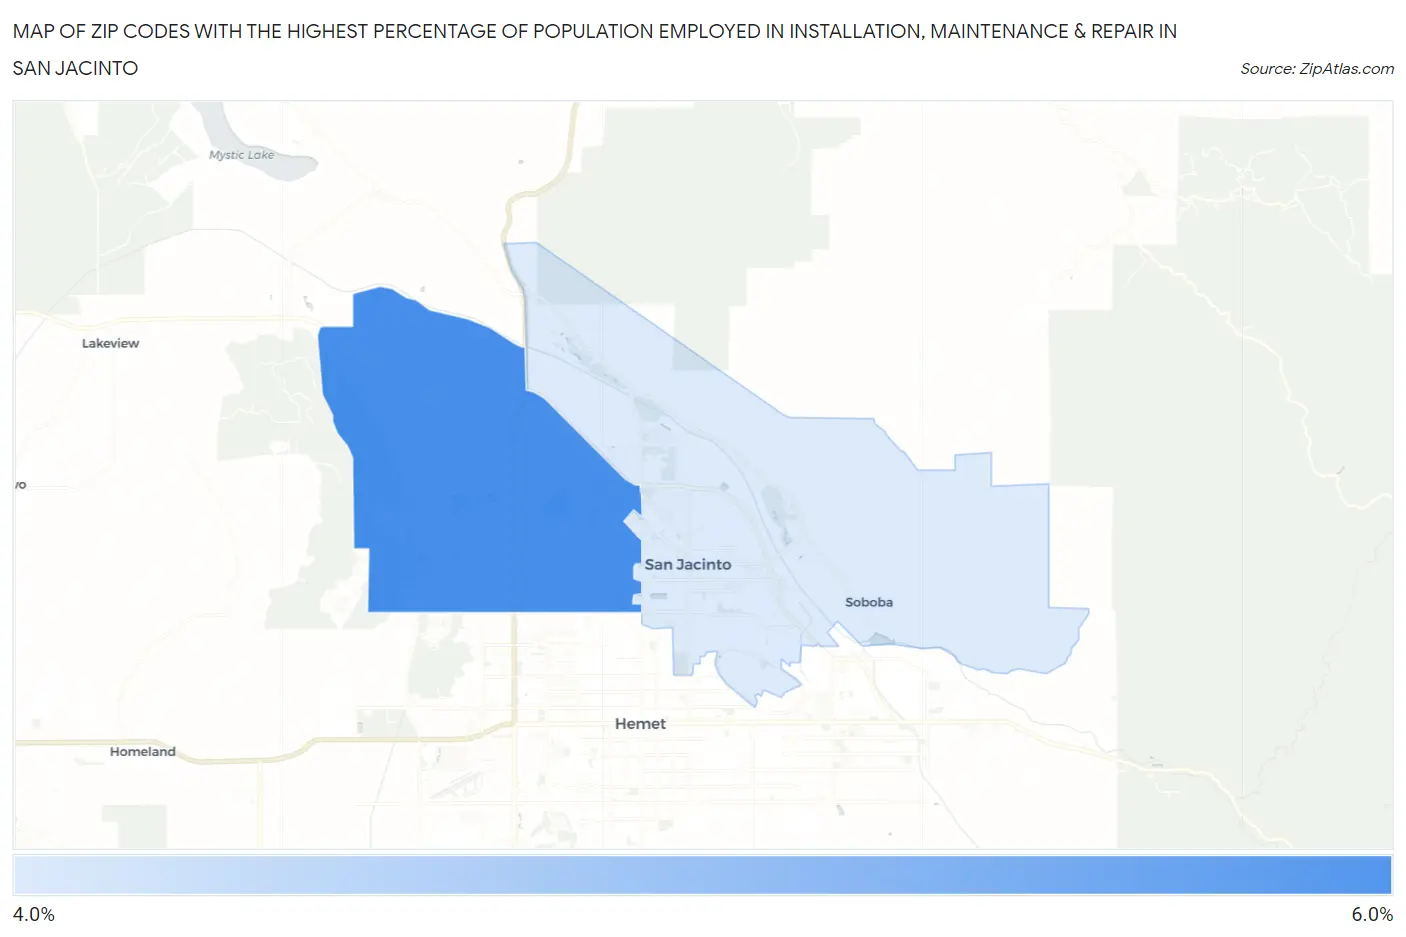
Map of Zip Codes with the Highest Percentage of Population Employed in Installation, Maintenance & Repair in San Jacinto
4.8%
5.5%
Zip Codes with the Highest Percentage of Population Employed in Installation, Maintenance & Repair in San Jacinto, CA
| Zip Code | % Employed | vs State | vs National | |
| 1. | 92582 | 5.5% | 2.6%(+2.96)#166 | 3.1%(+2.45)#7,222 |
| 2. | 92583 | 4.8% | 2.6%(+2.20)#225 | 3.1%(+1.69)#9,486 |
1
Common Questions
What are the Top Zip Codes with the Highest Percentage of Population Employed in Installation, Maintenance & Repair in San Jacinto, CA?
Top Zip Codes with the Highest Percentage of Population Employed in Installation, Maintenance & Repair in San Jacinto, CA are:
What zip code has the Highest Percentage of Population Employed in Installation, Maintenance & Repair in San Jacinto, CA?
92582 has the Highest Percentage of Population Employed in Installation, Maintenance & Repair in San Jacinto, CA with 5.5%.
What is the Percentage of Population Employed in Installation, Maintenance & Repair in San Jacinto, CA?
Percentage of Population Employed in Installation, Maintenance & Repair in San Jacinto is 5.2%.
What is the Percentage of Population Employed in Installation, Maintenance & Repair in California?
Percentage of Population Employed in Installation, Maintenance & Repair in California is 2.6%.
What is the Percentage of Population Employed in Installation, Maintenance & Repair in the United States?
Percentage of Population Employed in Installation, Maintenance & Repair in the United States is 3.1%.