Zip Codes with the Highest Percentage of Population Employed in Installation, Maintenance & Repair in Rialto, CA
RELATED REPORTS & OPTIONS
Installation, Maintenance & Repair
Rialto
Compare Zip Codes
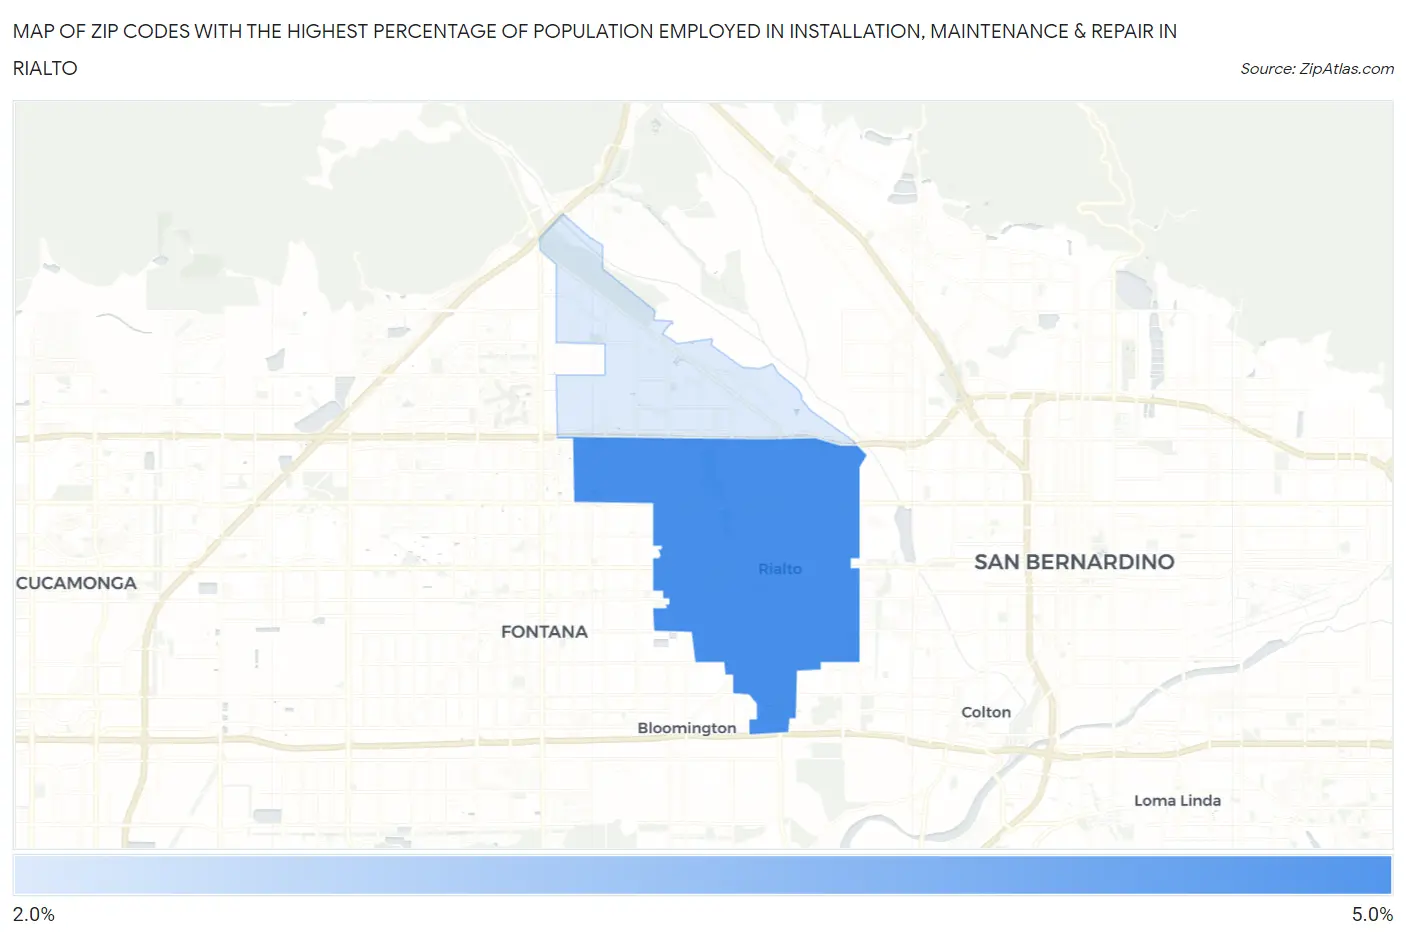
Map of Zip Codes with the Highest Percentage of Population Employed in Installation, Maintenance & Repair in Rialto
2.9%
4.2%
Zip Codes with the Highest Percentage of Population Employed in Installation, Maintenance & Repair in Rialto, CA
| Zip Code | % Employed | vs State | vs National | |
| 1. | 92376 | 4.2% | 2.6%(+1.61)#298 | 3.1%(+1.10)#11,661 |
| 2. | 92377 | 2.9% | 2.6%(+0.316)#645 | 3.1%(-0.195)#17,647 |
1
Common Questions
What are the Top Zip Codes with the Highest Percentage of Population Employed in Installation, Maintenance & Repair in Rialto, CA?
Top Zip Codes with the Highest Percentage of Population Employed in Installation, Maintenance & Repair in Rialto, CA are:
What zip code has the Highest Percentage of Population Employed in Installation, Maintenance & Repair in Rialto, CA?
92376 has the Highest Percentage of Population Employed in Installation, Maintenance & Repair in Rialto, CA with 4.2%.
What is the Percentage of Population Employed in Installation, Maintenance & Repair in Rialto, CA?
Percentage of Population Employed in Installation, Maintenance & Repair in Rialto is 3.8%.
What is the Percentage of Population Employed in Installation, Maintenance & Repair in California?
Percentage of Population Employed in Installation, Maintenance & Repair in California is 2.6%.
What is the Percentage of Population Employed in Installation, Maintenance & Repair in the United States?
Percentage of Population Employed in Installation, Maintenance & Repair in the United States is 3.1%.