Zip Codes with the Highest Percentage of Population Employed in Installation, Maintenance & Repair in Moreno Valley, CA
RELATED REPORTS & OPTIONS
Installation, Maintenance & Repair
Moreno Valley
Compare Zip Codes
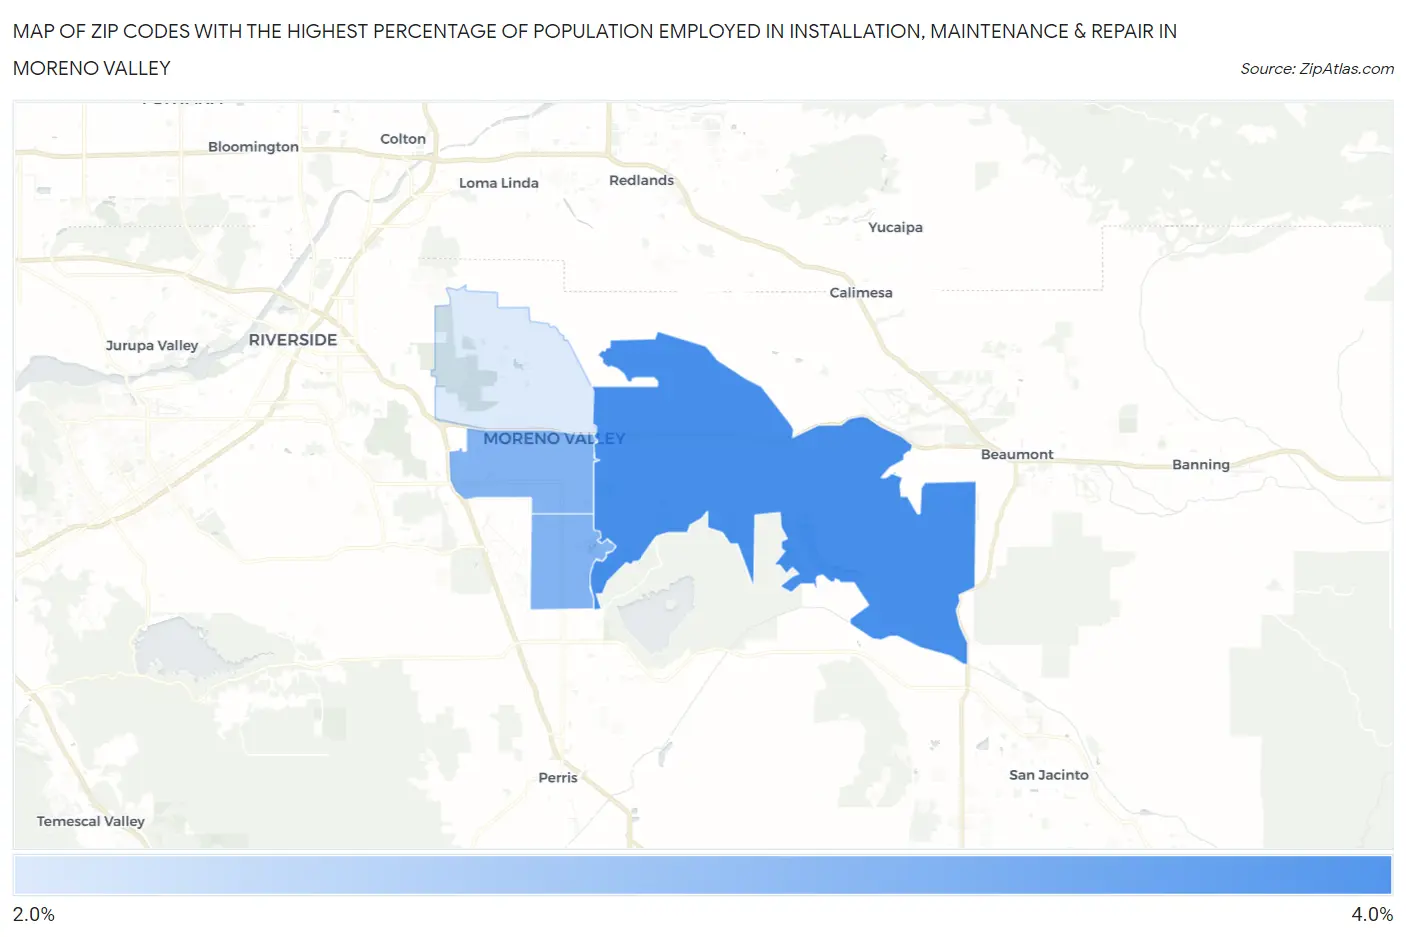
Map of Zip Codes with the Highest Percentage of Population Employed in Installation, Maintenance & Repair in Moreno Valley
3.0%
3.8%
Zip Codes with the Highest Percentage of Population Employed in Installation, Maintenance & Repair in Moreno Valley, CA
| Zip Code | % Employed | vs State | vs National | |
| 1. | 92555 | 3.8% | 2.6%(+1.21)#387 | 3.1%(+0.701)#13,383 |
| 2. | 92553 | 3.5% | 2.6%(+0.907)#464 | 3.1%(+0.395)#14,791 |
| 3. | 92551 | 3.5% | 2.6%(+0.906)#465 | 3.1%(+0.395)#14,792 |
| 4. | 92557 | 3.0% | 2.6%(+0.411)#609 | 3.1%(-0.101)#17,158 |
1
Common Questions
What are the Top 3 Zip Codes with the Highest Percentage of Population Employed in Installation, Maintenance & Repair in Moreno Valley, CA?
Top 3 Zip Codes with the Highest Percentage of Population Employed in Installation, Maintenance & Repair in Moreno Valley, CA are:
What zip code has the Highest Percentage of Population Employed in Installation, Maintenance & Repair in Moreno Valley, CA?
92555 has the Highest Percentage of Population Employed in Installation, Maintenance & Repair in Moreno Valley, CA with 3.8%.
What is the Percentage of Population Employed in Installation, Maintenance & Repair in Moreno Valley, CA?
Percentage of Population Employed in Installation, Maintenance & Repair in Moreno Valley is 3.4%.
What is the Percentage of Population Employed in Installation, Maintenance & Repair in California?
Percentage of Population Employed in Installation, Maintenance & Repair in California is 2.6%.
What is the Percentage of Population Employed in Installation, Maintenance & Repair in the United States?
Percentage of Population Employed in Installation, Maintenance & Repair in the United States is 3.1%.