Zip Codes with the Highest Percentage of Population Employed in Installation, Maintenance & Repair in Chino, CA
RELATED REPORTS & OPTIONS
Installation, Maintenance & Repair
Chino
Compare Zip Codes
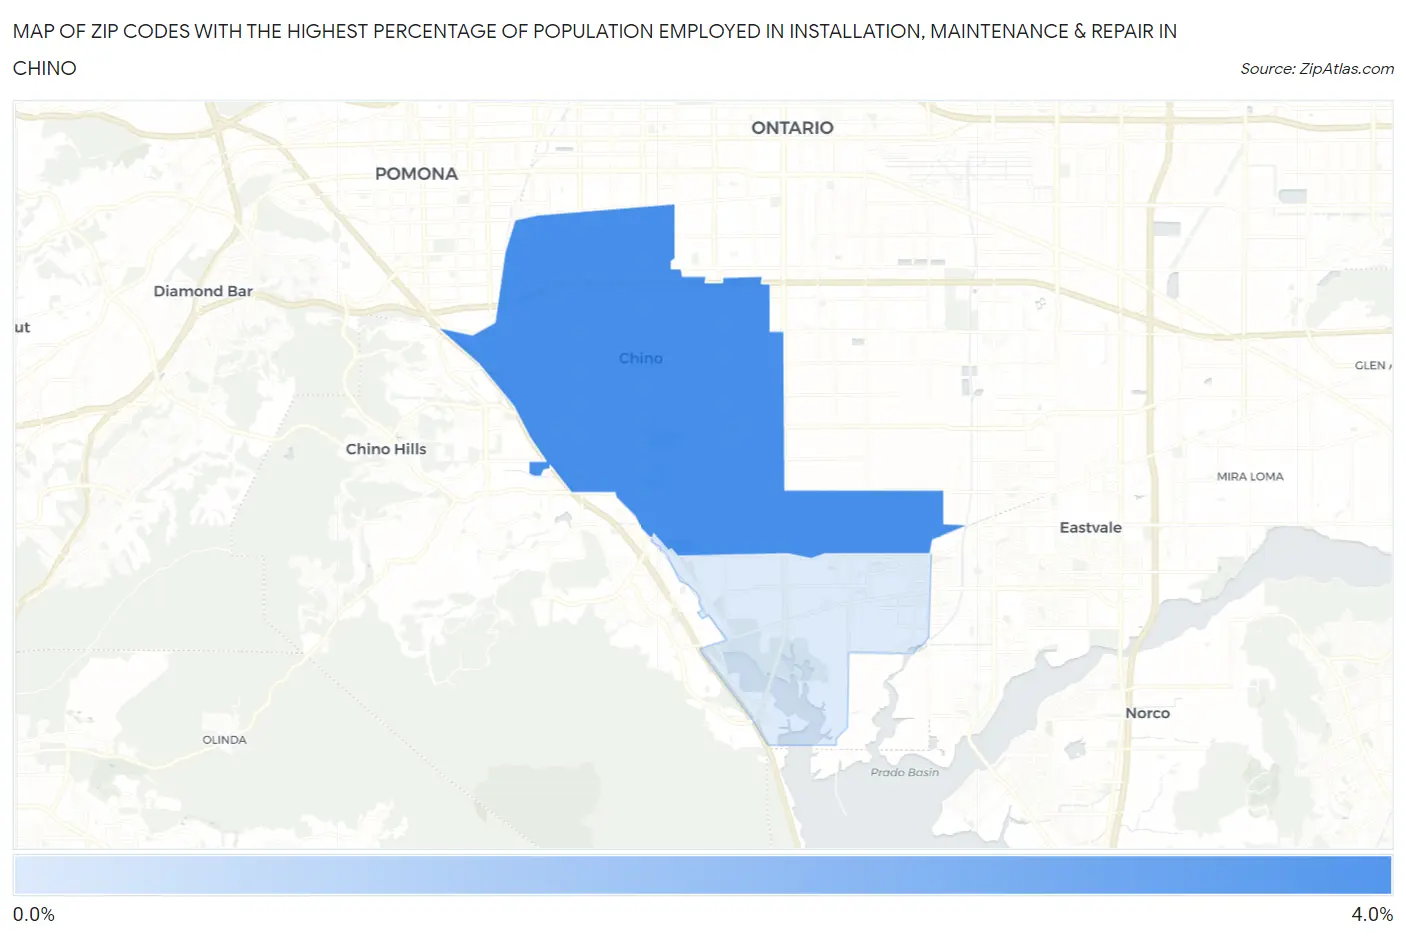
Map of Zip Codes with the Highest Percentage of Population Employed in Installation, Maintenance & Repair in Chino
0.11%
3.2%
Zip Codes with the Highest Percentage of Population Employed in Installation, Maintenance & Repair in Chino, CA
| Zip Code | % Employed | vs State | vs National | |
| 1. | 91710 | 3.2% | 2.6%(+0.614)#538 | 3.1%(+0.103)#16,180 |
| 2. | 91708 | 0.11% | 2.6%(-2.44)#1,442 | 3.1%(-2.95)#27,760 |
1
Common Questions
What are the Top Zip Codes with the Highest Percentage of Population Employed in Installation, Maintenance & Repair in Chino, CA?
Top Zip Codes with the Highest Percentage of Population Employed in Installation, Maintenance & Repair in Chino, CA are:
What zip code has the Highest Percentage of Population Employed in Installation, Maintenance & Repair in Chino, CA?
91710 has the Highest Percentage of Population Employed in Installation, Maintenance & Repair in Chino, CA with 3.2%.
What is the Percentage of Population Employed in Installation, Maintenance & Repair in Chino, CA?
Percentage of Population Employed in Installation, Maintenance & Repair in Chino is 2.7%.
What is the Percentage of Population Employed in Installation, Maintenance & Repair in California?
Percentage of Population Employed in Installation, Maintenance & Repair in California is 2.6%.
What is the Percentage of Population Employed in Installation, Maintenance & Repair in the United States?
Percentage of Population Employed in Installation, Maintenance & Repair in the United States is 3.1%.