Zip Codes with the Highest Percentage of Population Employed in Installation, Maintenance & Repair in Compton, CA
RELATED REPORTS & OPTIONS
Installation, Maintenance & Repair
Compton
Compare Zip Codes
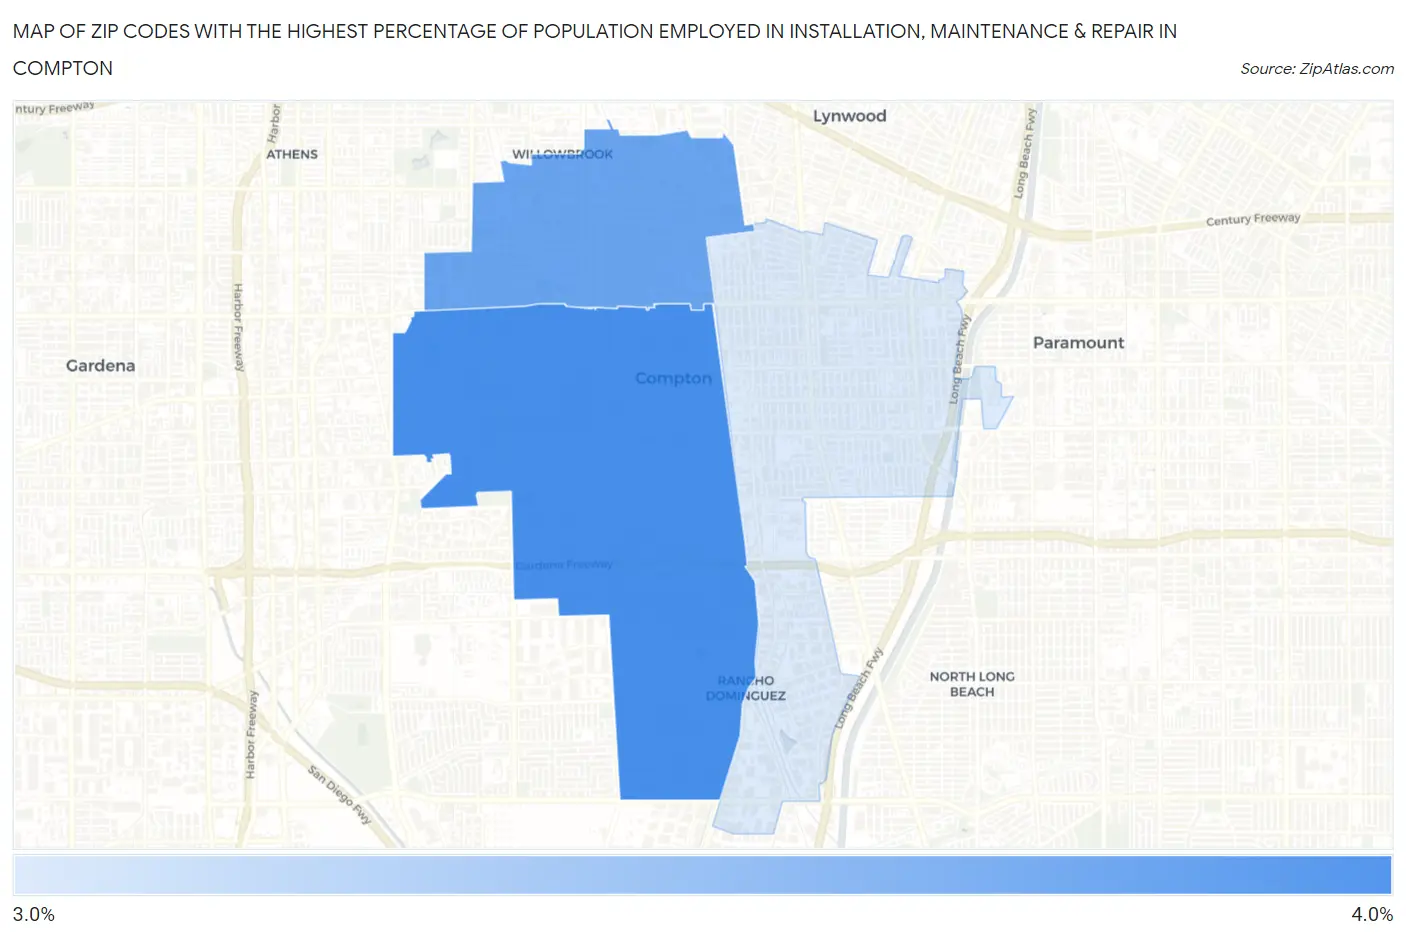
Map of Zip Codes with the Highest Percentage of Population Employed in Installation, Maintenance & Repair in Compton
3.1%
3.8%
Zip Codes with the Highest Percentage of Population Employed in Installation, Maintenance & Repair in Compton, CA
| Zip Code | % Employed | vs State | vs National | |
| 1. | 90220 | 3.8% | 2.6%(+1.25)#379 | 3.1%(+0.736)#13,206 |
| 2. | 90222 | 3.6% | 2.6%(+1.08)#423 | 3.1%(+0.572)#13,980 |
| 3. | 90221 | 3.1% | 2.6%(+0.546)#564 | 3.1%(+0.034)#16,515 |
1
Common Questions
What are the Top Zip Codes with the Highest Percentage of Population Employed in Installation, Maintenance & Repair in Compton, CA?
Top Zip Codes with the Highest Percentage of Population Employed in Installation, Maintenance & Repair in Compton, CA are:
What zip code has the Highest Percentage of Population Employed in Installation, Maintenance & Repair in Compton, CA?
90220 has the Highest Percentage of Population Employed in Installation, Maintenance & Repair in Compton, CA with 3.8%.
What is the Percentage of Population Employed in Installation, Maintenance & Repair in Compton, CA?
Percentage of Population Employed in Installation, Maintenance & Repair in Compton is 3.7%.
What is the Percentage of Population Employed in Installation, Maintenance & Repair in California?
Percentage of Population Employed in Installation, Maintenance & Repair in California is 2.6%.
What is the Percentage of Population Employed in Installation, Maintenance & Repair in the United States?
Percentage of Population Employed in Installation, Maintenance & Repair in the United States is 3.1%.