Zip Codes with the Highest Percentage of Population Employed in Installation, Maintenance & Repair in Malibu, CA
RELATED REPORTS & OPTIONS
Installation, Maintenance & Repair
Malibu
Compare Zip Codes
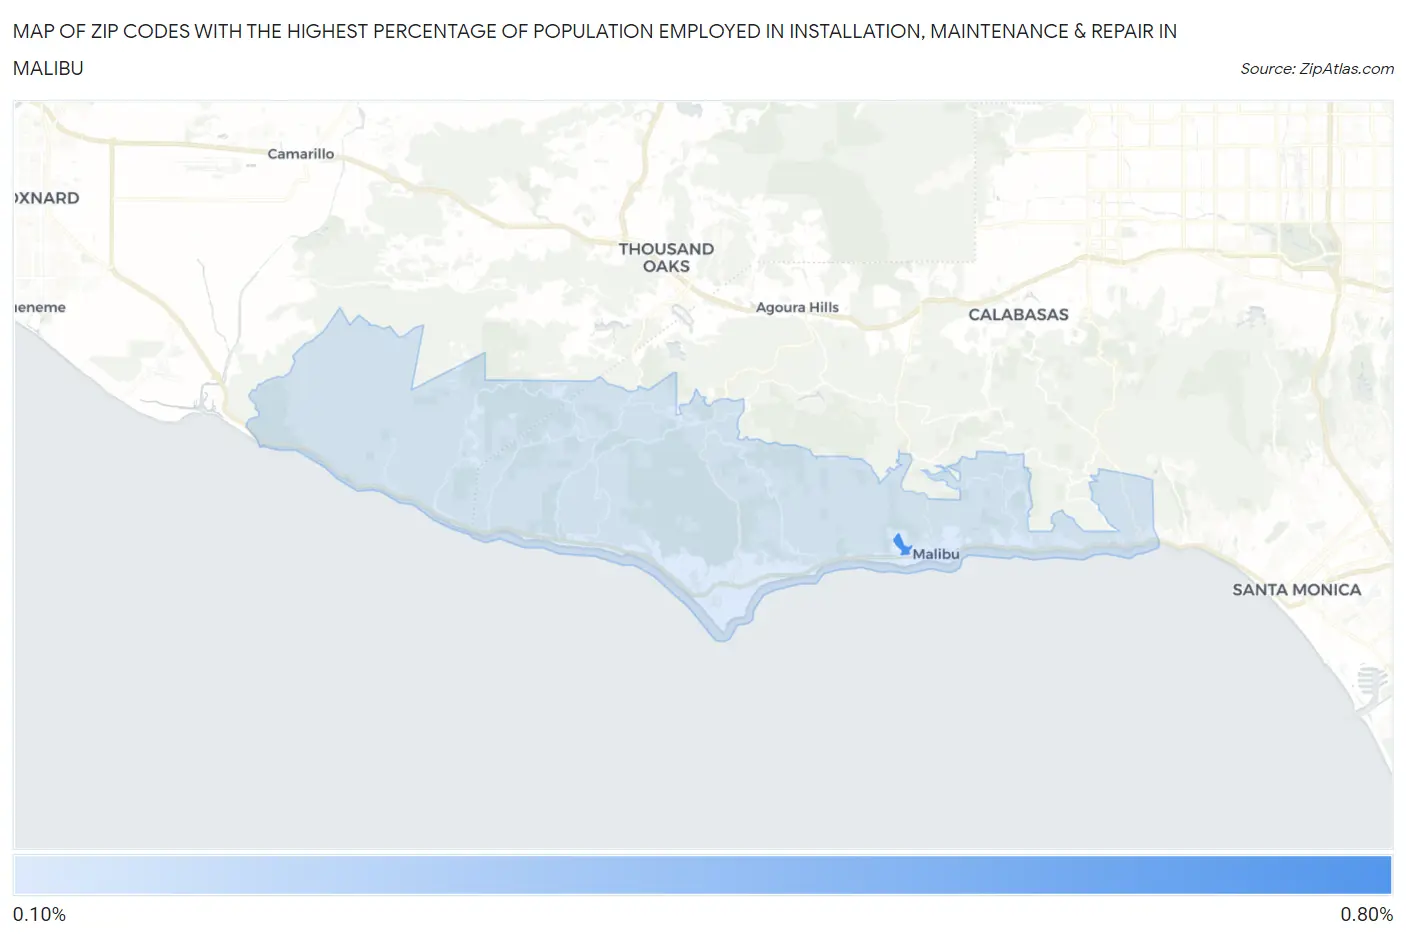
Map of Zip Codes with the Highest Percentage of Population Employed in Installation, Maintenance & Repair in Malibu
0.18%
0.78%
Zip Codes with the Highest Percentage of Population Employed in Installation, Maintenance & Repair in Malibu, CA
| Zip Code | % Employed | vs State | vs National | |
| 1. | 90263 | 0.78% | 2.6%(-1.77)#1,305 | 3.1%(-2.28)#26,550 |
| 2. | 90265 | 0.18% | 2.6%(-2.38)#1,433 | 3.1%(-2.89)#27,711 |
1
Common Questions
What are the Top Zip Codes with the Highest Percentage of Population Employed in Installation, Maintenance & Repair in Malibu, CA?
Top Zip Codes with the Highest Percentage of Population Employed in Installation, Maintenance & Repair in Malibu, CA are:
What zip code has the Highest Percentage of Population Employed in Installation, Maintenance & Repair in Malibu, CA?
90263 has the Highest Percentage of Population Employed in Installation, Maintenance & Repair in Malibu, CA with 0.78%.
What is the Percentage of Population Employed in Installation, Maintenance & Repair in California?
Percentage of Population Employed in Installation, Maintenance & Repair in California is 2.6%.
What is the Percentage of Population Employed in Installation, Maintenance & Repair in the United States?
Percentage of Population Employed in Installation, Maintenance & Repair in the United States is 3.1%.