Zip Codes with the Highest Percentage of Population Employed in Food Preparation & Serving in Sun City, AZ
RELATED REPORTS & OPTIONS
Food Preparation & Serving
Sun City
Compare Zip Codes
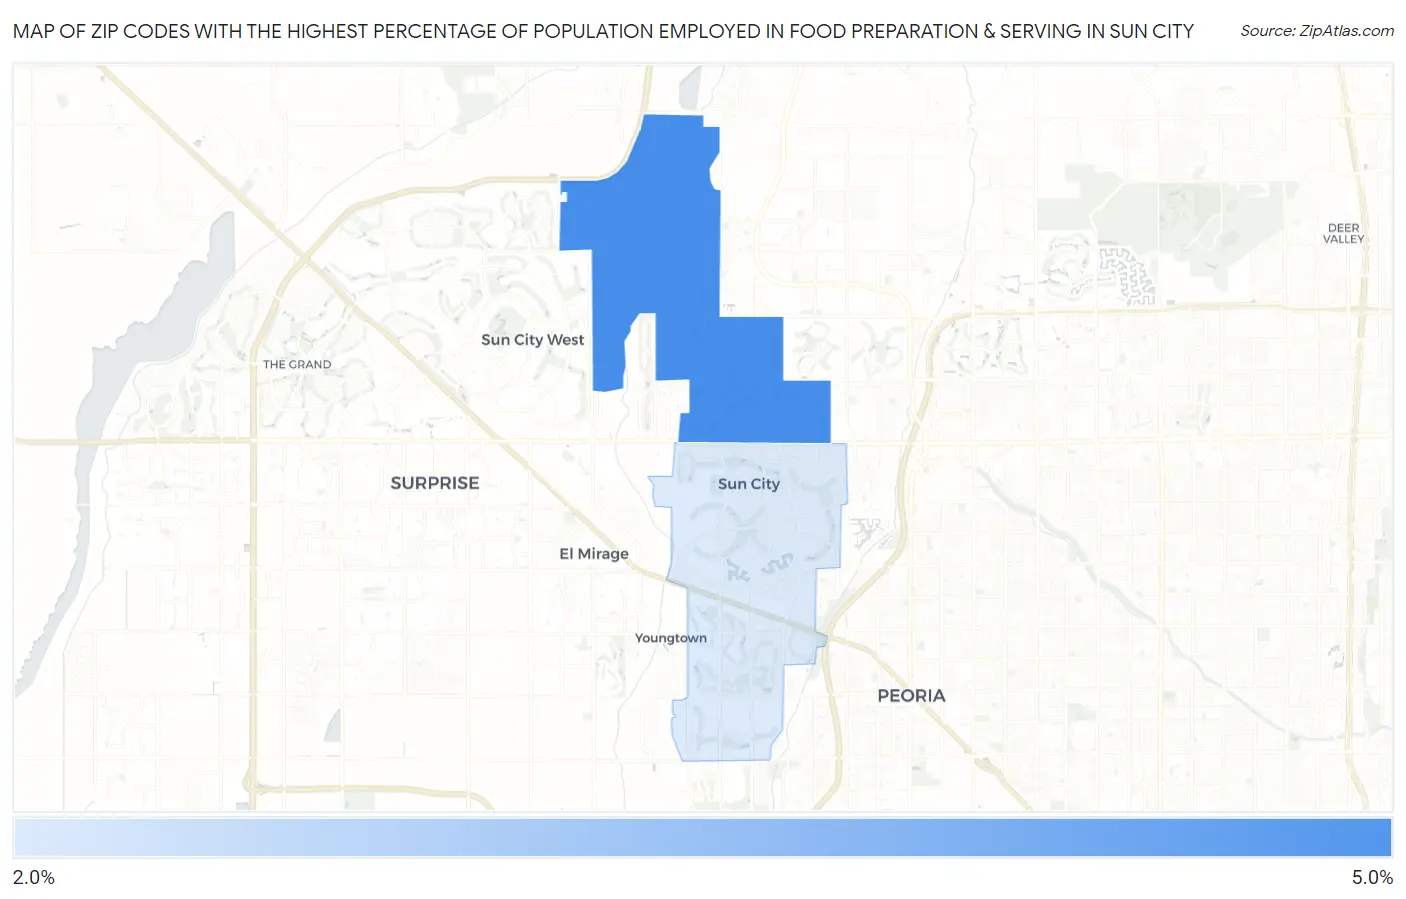
Map of Zip Codes with the Highest Percentage of Population Employed in Food Preparation & Serving in Sun City
2.1%
4.9%
Zip Codes with the Highest Percentage of Population Employed in Food Preparation & Serving in Sun City, AZ
| Zip Code | % Employed | vs State | vs National | |
| 1. | 85373 | 4.9% | 5.7%(-0.746)#200 | 5.3%(-0.365)#13,257 |
| 2. | 85351 | 2.1% | 5.7%(-3.59)#326 | 5.3%(-3.21)#24,458 |
1
Common Questions
What are the Top Zip Codes with the Highest Percentage of Population Employed in Food Preparation & Serving in Sun City, AZ?
Top Zip Codes with the Highest Percentage of Population Employed in Food Preparation & Serving in Sun City, AZ are:
What zip code has the Highest Percentage of Population Employed in Food Preparation & Serving in Sun City, AZ?
85373 has the Highest Percentage of Population Employed in Food Preparation & Serving in Sun City, AZ with 4.9%.
What is the Percentage of Population Employed in Food Preparation & Serving in Sun City, AZ?
Percentage of Population Employed in Food Preparation & Serving in Sun City is 2.1%.
What is the Percentage of Population Employed in Food Preparation & Serving in Arizona?
Percentage of Population Employed in Food Preparation & Serving in Arizona is 5.7%.
What is the Percentage of Population Employed in Food Preparation & Serving in the United States?
Percentage of Population Employed in Food Preparation & Serving in the United States is 5.3%.