Tiburones, PR Map & Demographics
Tiburones Map
Tiburones Overview
$5,835
PER CAPITA INCOME
$10,993
AVG FAMILY INCOME
$11,804
AVG HOUSEHOLD INCOME
0.44
INEQUALITY / GINI INDEX
1,261
TOTAL POPULATION
730
MALE POPULATION
531
FEMALE POPULATION
137.48
MALES / 100 FEMALES
72.74
FEMALES / 100 MALES
35.1
MEDIAN AGE
2.9
AVG FAMILY SIZE
2.6
AVG HOUSEHOLD SIZE
399
LABOR FORCE [ PEOPLE ]
41.4%
PERCENT IN LABOR FORCE
39.1%
UNEMPLOYMENT RATE
Income in Tiburones
Income Overview in Tiburones
Per Capita Income in Tiburones is $5,835, while median incomes of families and households are $10,993 and $11,804 respectively.
| Characteristic | Number | Measure |
| Per Capita Income | 1,261 | $5,835 |
| Median Family Income | 360 | $10,993 |
| Mean Family Income | 360 | $15,883 |
| Median Household Income | 486 | $11,804 |
| Mean Household Income | 486 | $15,275 |
| Income Deficit | 360 | $0 |
| Wage / Income Gap (%) | 1,261 | 0.00% |
| Wage / Income Gap ($) | 1,261 | 100.00¢ per $1 |
| Gini / Inequality Index | 1,261 | 0.44 |
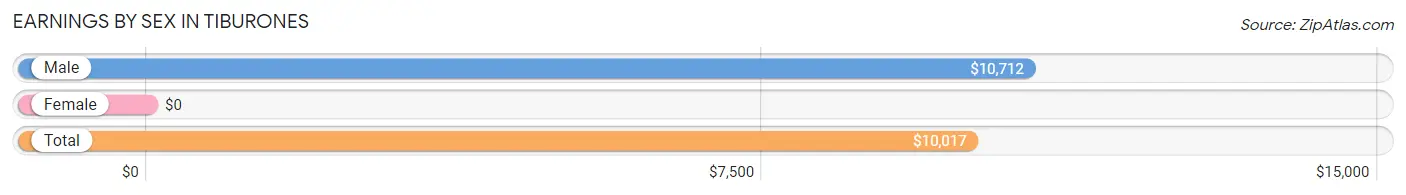
Earnings by Sex in Tiburones
| Sex | Number | Average Earnings |
| Male | 167 (51.4%) | $10,712 |
| Female | 158 (48.6%) | $0 |
| Total | 325 (100.0%) | $10,017 |
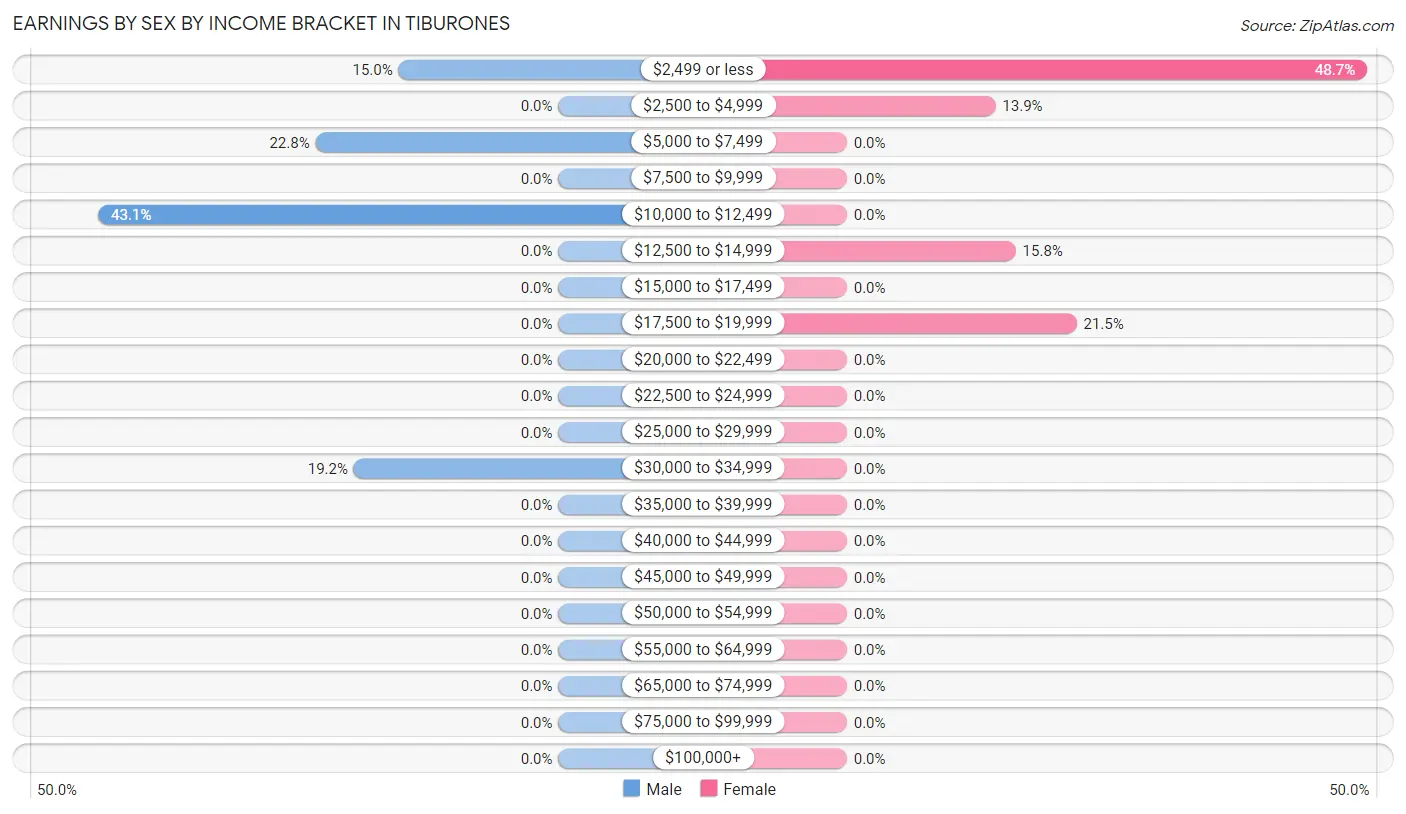
Earnings by Sex by Income Bracket in Tiburones
The most common earnings brackets in Tiburones are $10,000 to $12,499 for men (72 | 43.1%) and $2,499 or less for women (77 | 48.7%).
| Income | Male | Female |
| $2,499 or less | 25 (15.0%) | 77 (48.7%) |
| $2,500 to $4,999 | 0 (0.0%) | 22 (13.9%) |
| $5,000 to $7,499 | 38 (22.8%) | 0 (0.0%) |
| $7,500 to $9,999 | 0 (0.0%) | 0 (0.0%) |
| $10,000 to $12,499 | 72 (43.1%) | 0 (0.0%) |
| $12,500 to $14,999 | 0 (0.0%) | 25 (15.8%) |
| $15,000 to $17,499 | 0 (0.0%) | 0 (0.0%) |
| $17,500 to $19,999 | 0 (0.0%) | 34 (21.5%) |
| $20,000 to $22,499 | 0 (0.0%) | 0 (0.0%) |
| $22,500 to $24,999 | 0 (0.0%) | 0 (0.0%) |
| $25,000 to $29,999 | 0 (0.0%) | 0 (0.0%) |
| $30,000 to $34,999 | 32 (19.2%) | 0 (0.0%) |
| $35,000 to $39,999 | 0 (0.0%) | 0 (0.0%) |
| $40,000 to $44,999 | 0 (0.0%) | 0 (0.0%) |
| $45,000 to $49,999 | 0 (0.0%) | 0 (0.0%) |
| $50,000 to $54,999 | 0 (0.0%) | 0 (0.0%) |
| $55,000 to $64,999 | 0 (0.0%) | 0 (0.0%) |
| $65,000 to $74,999 | 0 (0.0%) | 0 (0.0%) |
| $75,000 to $99,999 | 0 (0.0%) | 0 (0.0%) |
| $100,000+ | 0 (0.0%) | 0 (0.0%) |
| Total | 167 (100.0%) | 158 (100.0%) |
Earnings by Sex by Educational Attainment in Tiburones
| Educational Attainment | Male Income | Female Income |
| Less than High School | - | - |
| High School Diploma | - | - |
| College or Associate's Degree | - | - |
| Bachelor's Degree | - | - |
| Graduate Degree | - | - |
| Total | - | - |
Family Income in Tiburones
Family Income Brackets in Tiburones
According to the Tiburones family income data, there are 151 families falling into the less than $10,000 income range, which is the most common income bracket and makes up 41.9% of all families.
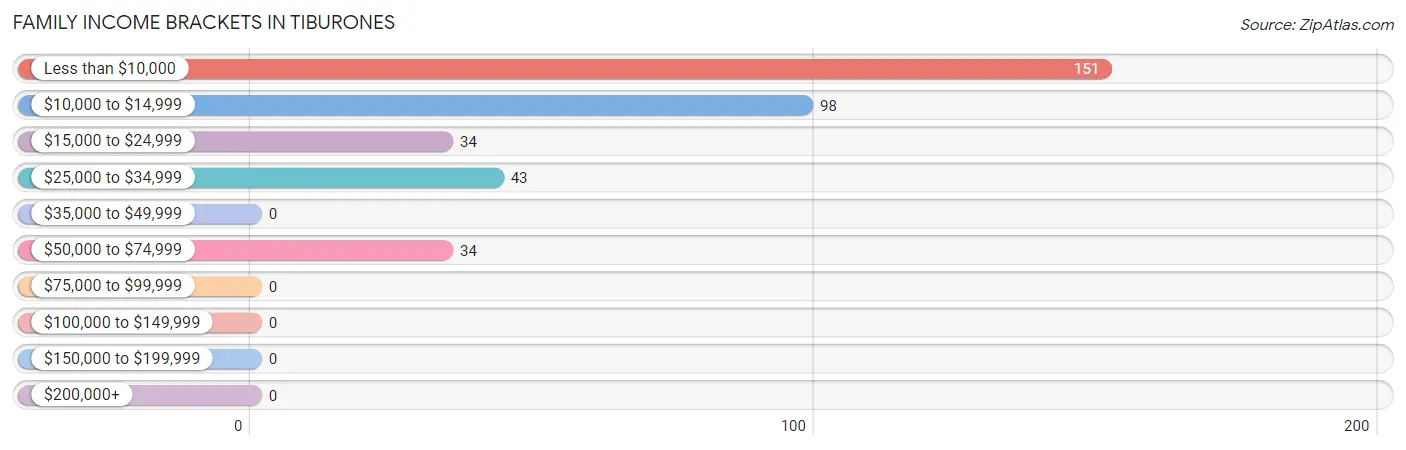
| Income Bracket | # Families | % Families |
| Less than $10,000 | 151 | 41.9% |
| $10,000 to $14,999 | 98 | 27.2% |
| $15,000 to $24,999 | 34 | 9.4% |
| $25,000 to $34,999 | 43 | 11.9% |
| $35,000 to $49,999 | 0 | 0.0% |
| $50,000 to $74,999 | 34 | 9.4% |
| $75,000 to $99,999 | 0 | 0.0% |
| $100,000 to $149,999 | 0 | 0.0% |
| $150,000 to $199,999 | 0 | 0.0% |
| $200,000+ | 0 | 0.0% |
Family Income by Famaliy Size in Tiburones
2-person families (133 | 36.9%) account for the highest median family income in Tiburones with $23,272 per family, while 2-person families (133 | 36.9%) have the highest median income of $11,636 per family member.
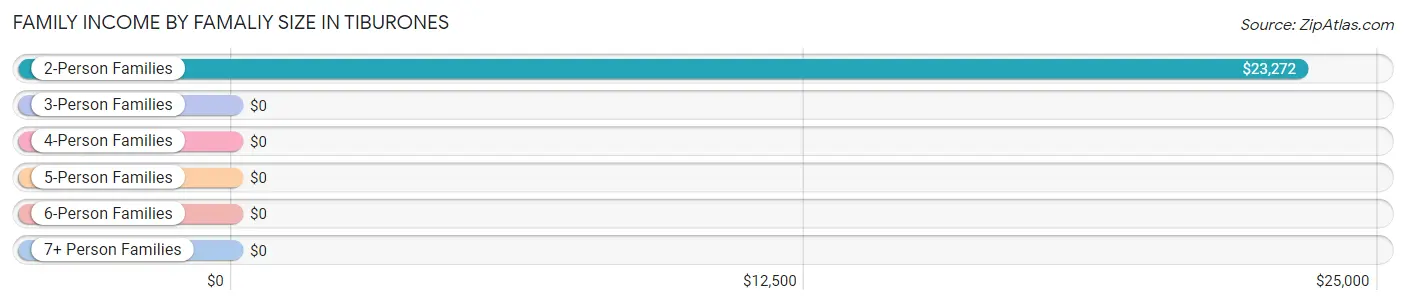
| Income Bracket | # Families | Median Income |
| 2-Person Families | 133 (36.9%) | $23,272 |
| 3-Person Families | 131 (36.4%) | $0 |
| 4-Person Families | 96 (26.7%) | $0 |
| 5-Person Families | 0 (0.0%) | $0 |
| 6-Person Families | 0 (0.0%) | $0 |
| 7+ Person Families | 0 (0.0%) | $0 |
| Total | 360 (100.0%) | $10,993 |
Family Income by Number of Earners in Tiburones
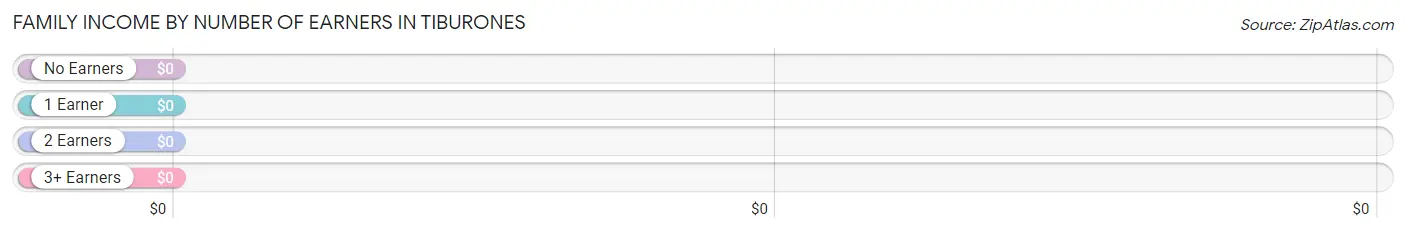
| Number of Earners | # Families | Median Income |
| No Earners | 141 (39.2%) | $0 |
| 1 Earner | 147 (40.8%) | $0 |
| 2 Earners | 72 (20.0%) | $0 |
| 3+ Earners | 0 (0.0%) | $0 |
| Total | 360 (100.0%) | $10,993 |
Household Income in Tiburones
Household Income Brackets in Tiburones
With 173 households falling in the category, the less than $10,000 income range is the most frequent in Tiburones, accounting for 35.6% of all households.
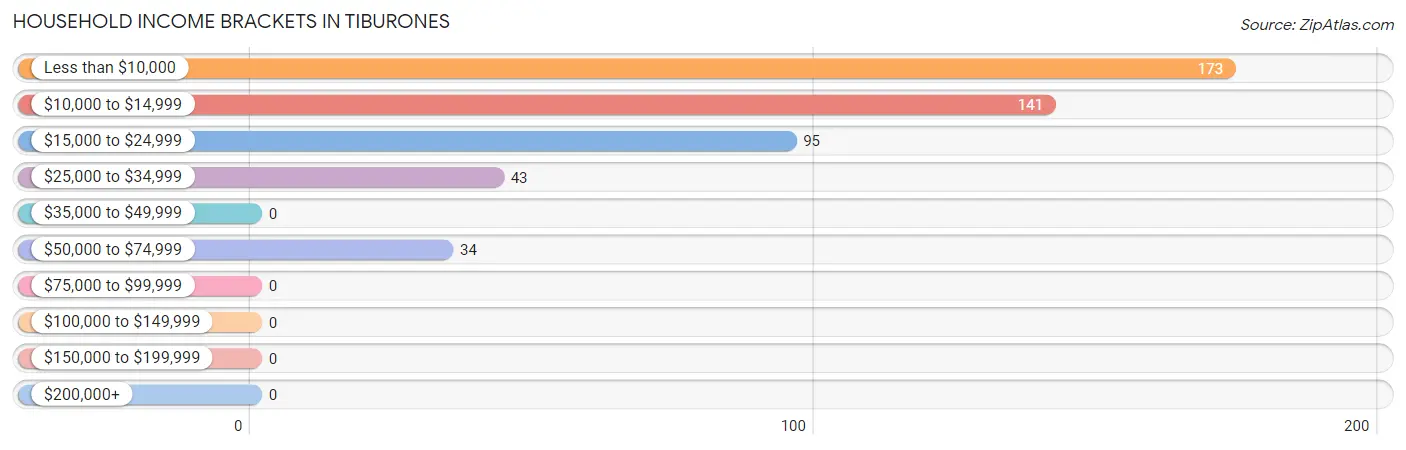
| Income Bracket | # Households | % Households |
| Less than $10,000 | 173 | 35.6% |
| $10,000 to $14,999 | 141 | 29.0% |
| $15,000 to $24,999 | 95 | 19.5% |
| $25,000 to $34,999 | 43 | 8.8% |
| $35,000 to $49,999 | 0 | 0.0% |
| $50,000 to $74,999 | 34 | 7.0% |
| $75,000 to $99,999 | 0 | 0.0% |
| $100,000 to $149,999 | 0 | 0.0% |
| $150,000 to $199,999 | 0 | 0.0% |
| $200,000+ | 0 | 0.0% |
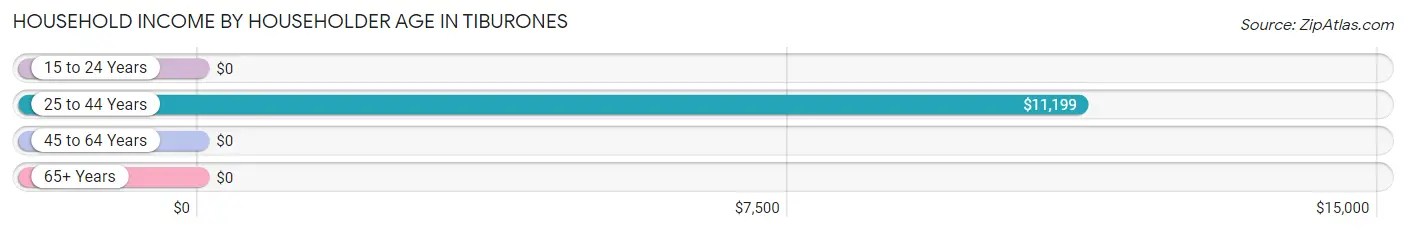
Household Income by Householder Age in Tiburones
The median household income in Tiburones is $11,804, with the highest median household income of $11,199 found in the 25 to 44 years age bracket for the primary householder. A total of 212 households (43.6%) fall into this category.
| Income Bracket | # Households | Median Income |
| 15 to 24 Years | 0 (0.0%) | $0 |
| 25 to 44 Years | 212 (43.6%) | $11,199 |
| 45 to 64 Years | 153 (31.5%) | $0 |
| 65+ Years | 121 (24.9%) | $0 |
| Total | 486 (100.0%) | $11,804 |
Poverty in Tiburones
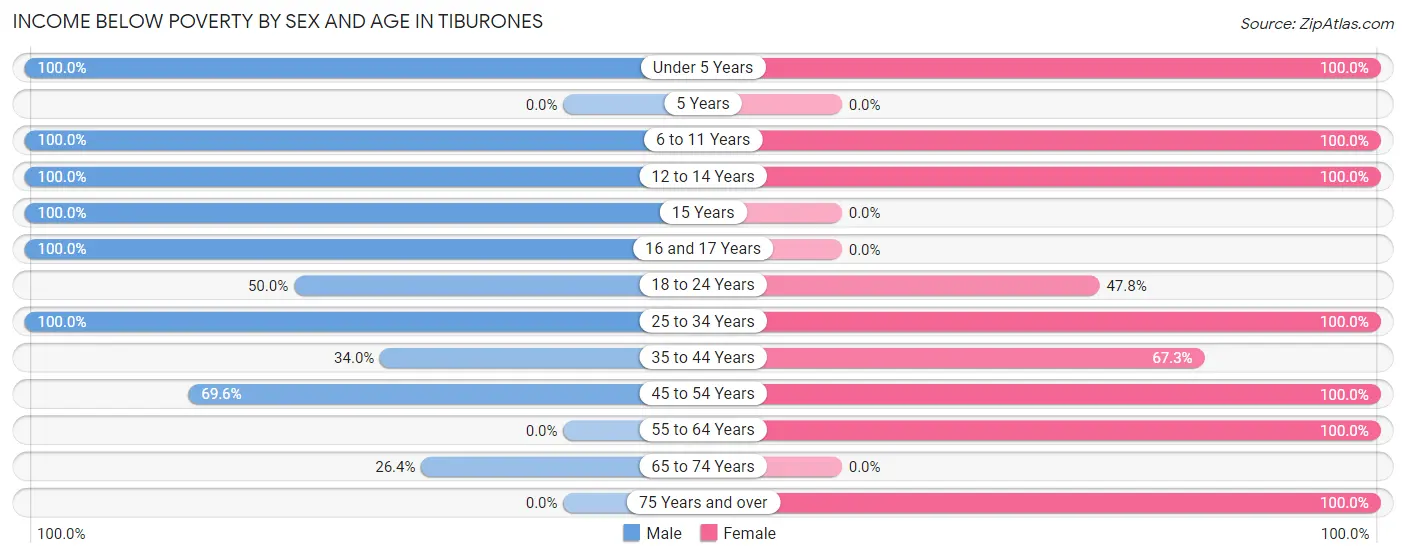
Income Below Poverty by Sex and Age in Tiburones
With 70.6% poverty level for males and 80.8% for females among the residents of Tiburones, under 5 year old males and under 5 year old females are the most vulnerable to poverty, with 32 males (100.0%) and 27 females (100.0%) in their respective age groups living below the poverty level.
| Age Bracket | Male | Female |
| Under 5 Years | 32 (100.0%) | 27 (100.0%) |
| 5 Years | 0 (0.0%) | 0 (0.0%) |
| 6 to 11 Years | 113 (100.0%) | 30 (100.0%) |
| 12 to 14 Years | 34 (100.0%) | 35 (100.0%) |
| 15 Years | 26 (100.0%) | 0 (0.0%) |
| 16 and 17 Years | 47 (100.0%) | 0 (0.0%) |
| 18 to 24 Years | 44 (50.0%) | 22 (47.8%) |
| 25 to 34 Years | 74 (100.0%) | 74 (100.0%) |
| 35 to 44 Years | 34 (34.0%) | 70 (67.3%) |
| 45 to 54 Years | 87 (69.6%) | 121 (100.0%) |
| 55 to 64 Years | 0 (0.0%) | 19 (100.0%) |
| 65 to 74 Years | 24 (26.4%) | 0 (0.0%) |
| 75 Years and over | 0 (0.0%) | 31 (100.0%) |
| Total | 515 (70.6%) | 429 (80.8%) |
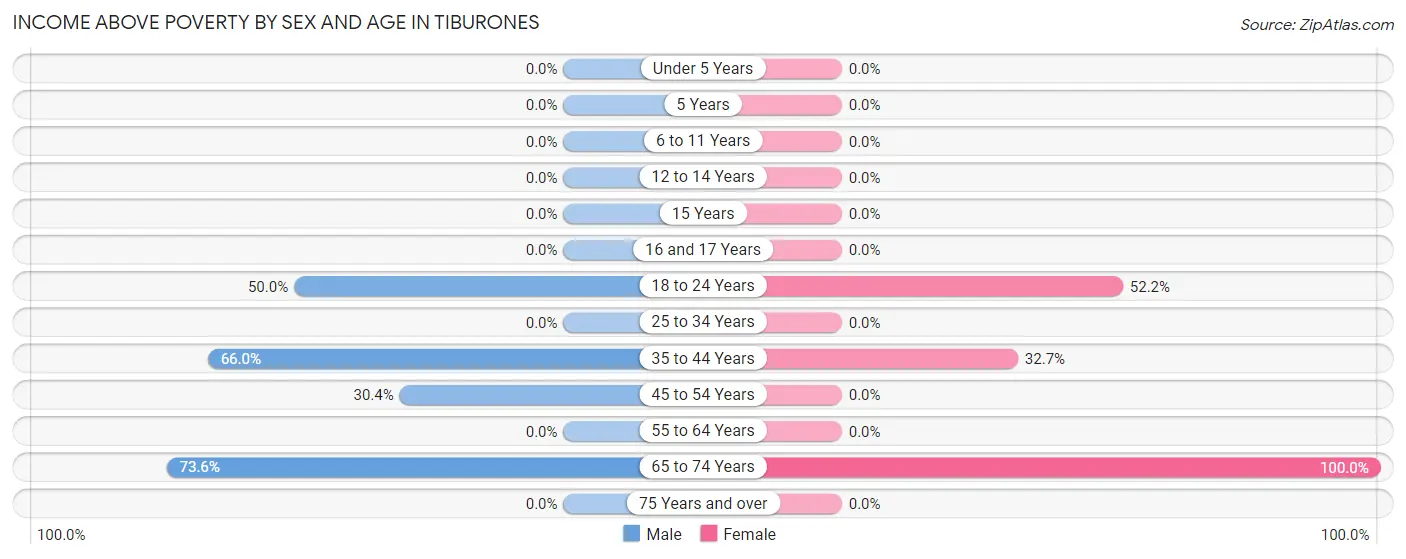
Income Above Poverty by Sex and Age in Tiburones
According to the poverty statistics in Tiburones, males aged 65 to 74 years and females aged 65 to 74 years are the age groups that are most secure financially, with 73.6% of males and 100.0% of females in these age groups living above the poverty line.
| Age Bracket | Male | Female |
| Under 5 Years | 0 (0.0%) | 0 (0.0%) |
| 5 Years | 0 (0.0%) | 0 (0.0%) |
| 6 to 11 Years | 0 (0.0%) | 0 (0.0%) |
| 12 to 14 Years | 0 (0.0%) | 0 (0.0%) |
| 15 Years | 0 (0.0%) | 0 (0.0%) |
| 16 and 17 Years | 0 (0.0%) | 0 (0.0%) |
| 18 to 24 Years | 44 (50.0%) | 24 (52.2%) |
| 25 to 34 Years | 0 (0.0%) | 0 (0.0%) |
| 35 to 44 Years | 66 (66.0%) | 34 (32.7%) |
| 45 to 54 Years | 38 (30.4%) | 0 (0.0%) |
| 55 to 64 Years | 0 (0.0%) | 0 (0.0%) |
| 65 to 74 Years | 67 (73.6%) | 44 (100.0%) |
| 75 Years and over | 0 (0.0%) | 0 (0.0%) |
| Total | 215 (29.4%) | 102 (19.2%) |
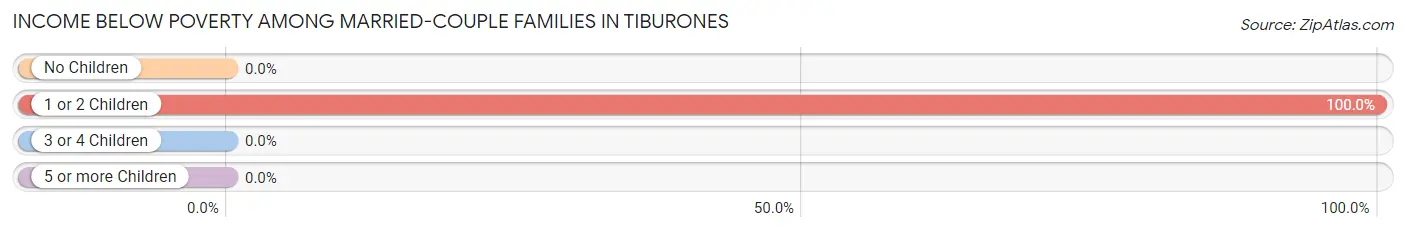
Income Below Poverty Among Married-Couple Families in Tiburones
The poverty statistics for married-couple families in Tiburones show that 48.7% or 73 of the total 150 families live below the poverty line. Families with 1 or 2 children have the highest poverty rate of 100.0%, comprising of 73 families. On the other hand, families with no children have the lowest poverty rate of 0.0%, which includes 0 families.
| Children | Above Poverty | Below Poverty |
| No Children | 77 (100.0%) | 0 (0.0%) |
| 1 or 2 Children | 0 (0.0%) | 73 (100.0%) |
| 3 or 4 Children | 0 (0.0%) | 0 (0.0%) |
| 5 or more Children | 0 (0.0%) | 0 (0.0%) |
| Total | 77 (51.3%) | 73 (48.7%) |
Income Below Poverty Among Single-Parent Households in Tiburones
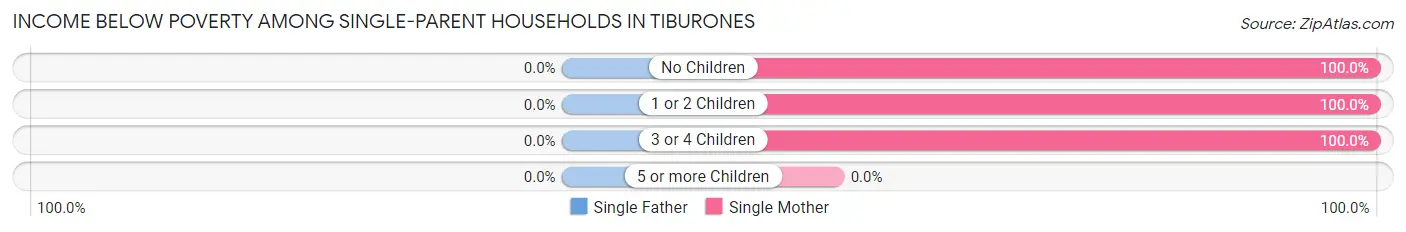
| Children | Single Father | Single Mother |
| No Children | 0 (0.0%) | 31 (100.0%) |
| 1 or 2 Children | 0 (0.0%) | 106 (100.0%) |
| 3 or 4 Children | 0 (0.0%) | 39 (100.0%) |
| 5 or more Children | 0 (0.0%) | 0 (0.0%) |
| Total | 0 (0.0%) | 176 (100.0%) |
Income Below Poverty Among Married-Couple vs Single-Parent Households in Tiburones
The poverty data for Tiburones shows that 73 of the married-couple family households (48.7%) and 176 of the single-parent households (83.8%) are living below the poverty level. Within the married-couple family households, those with 1 or 2 children have the highest poverty rate, with 73 households (100.0%) falling below the poverty line. Among the single-parent households, those with 1 or 2 children have the highest poverty rate, with 106 household (100.0%) living below poverty.
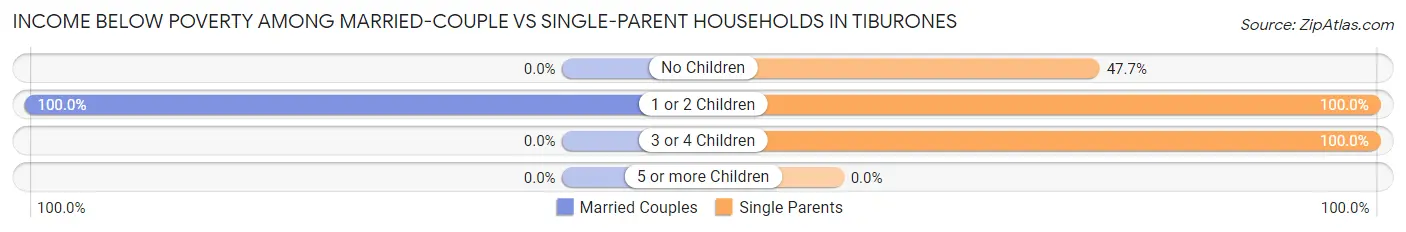
| Children | Married-Couple Families | Single-Parent Households |
| No Children | 0 (0.0%) | 31 (47.7%) |
| 1 or 2 Children | 73 (100.0%) | 106 (100.0%) |
| 3 or 4 Children | 0 (0.0%) | 39 (100.0%) |
| 5 or more Children | 0 (0.0%) | 0 (0.0%) |
| Total | 73 (48.7%) | 176 (83.8%) |
Race in Tiburones
The most populous races in Tiburones are Hispanic or Latino (1,261 | 100.0%), White / Caucasian (824 | 65.3%), and Two or more Races (321 | 25.5%).
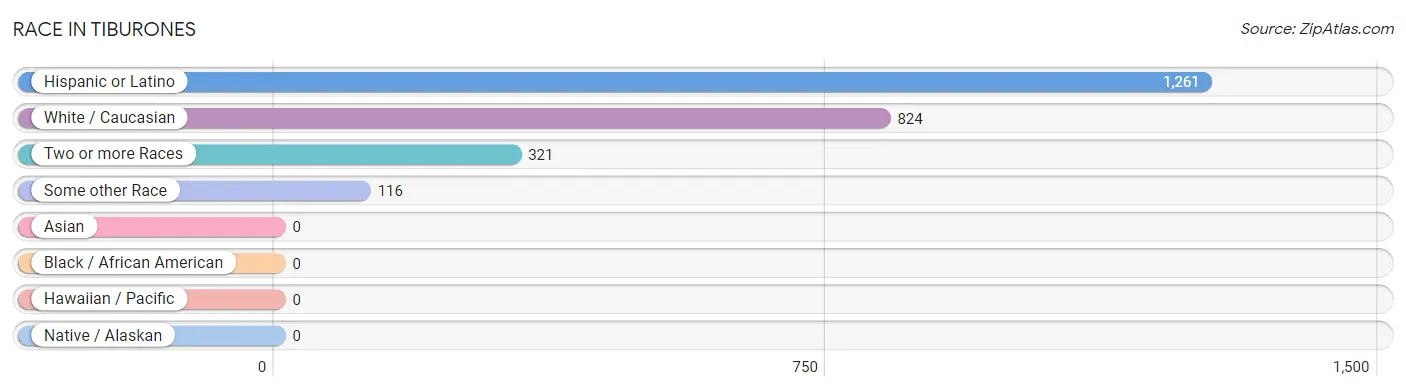
| Race | # Population | % Population |
| Asian | 0 | 0.0% |
| Black / African American | 0 | 0.0% |
| Hawaiian / Pacific | 0 | 0.0% |
| Hispanic or Latino | 1,261 | 100.0% |
| Native / Alaskan | 0 | 0.0% |
| White / Caucasian | 824 | 65.3% |
| Two or more Races | 321 | 25.5% |
| Some other Race | 116 | 9.2% |
| Total | 1,261 | 100.0% |
Ancestry in Tiburones
The most populous ancestries reported in Tiburones are , and Puerto Rican (1,261 | 100.0%), together accounting for 100.0% of all Tiburones residents.

| Ancestry | # Population | % Population |
| Puerto Rican | 1,261 | 100.0% | View All 1 Rows |
Immigrants in Tiburones

| Immigration Origin | # Population | % Population | View All 0 Rows |
Sex and Age in Tiburones
Sex and Age in Tiburones
The most populous age groups in Tiburones are 10 to 14 Years (108 | 14.8%) for men and 40 to 44 Years (104 | 19.6%) for women.
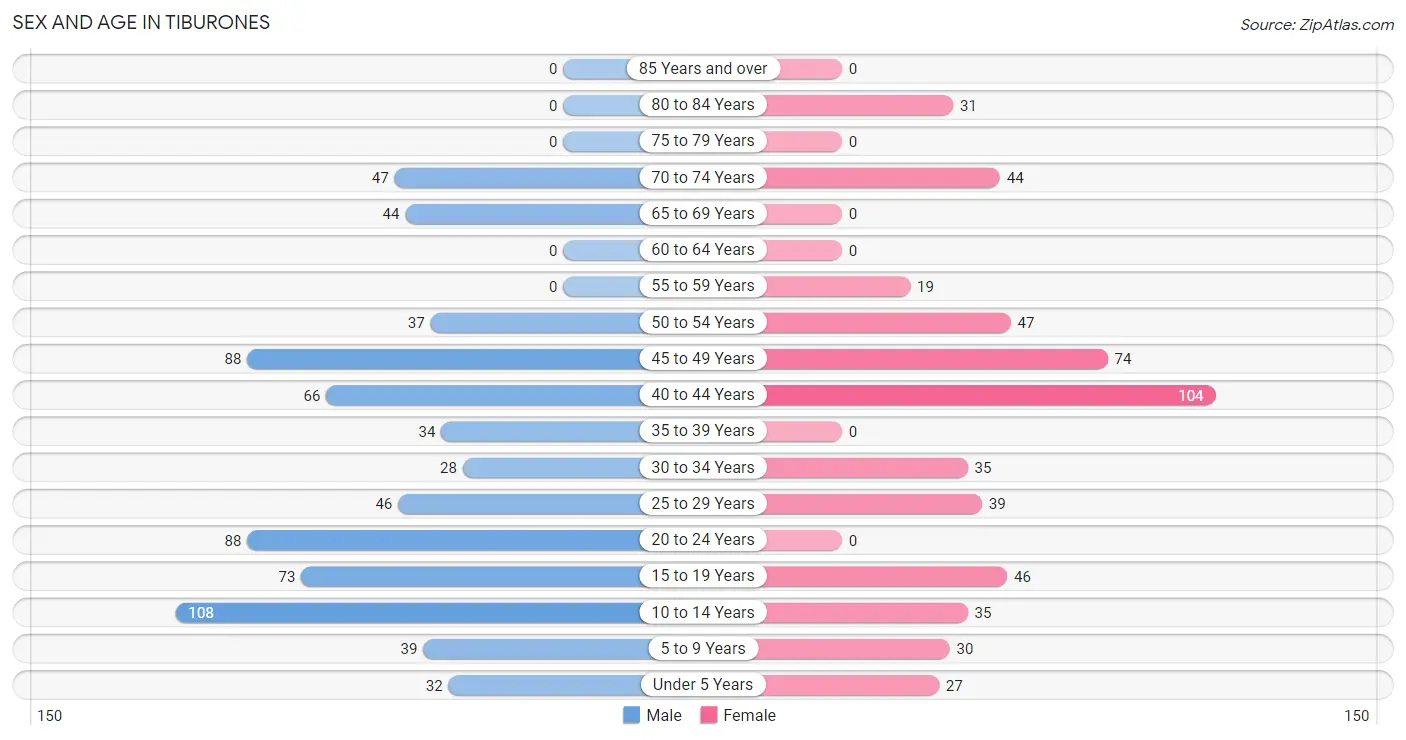
| Age Bracket | Male | Female |
| Under 5 Years | 32 (4.4%) | 27 (5.1%) |
| 5 to 9 Years | 39 (5.3%) | 30 (5.7%) |
| 10 to 14 Years | 108 (14.8%) | 35 (6.6%) |
| 15 to 19 Years | 73 (10.0%) | 46 (8.7%) |
| 20 to 24 Years | 88 (12.0%) | 0 (0.0%) |
| 25 to 29 Years | 46 (6.3%) | 39 (7.3%) |
| 30 to 34 Years | 28 (3.8%) | 35 (6.6%) |
| 35 to 39 Years | 34 (4.7%) | 0 (0.0%) |
| 40 to 44 Years | 66 (9.0%) | 104 (19.6%) |
| 45 to 49 Years | 88 (12.0%) | 74 (13.9%) |
| 50 to 54 Years | 37 (5.1%) | 47 (8.8%) |
| 55 to 59 Years | 0 (0.0%) | 19 (3.6%) |
| 60 to 64 Years | 0 (0.0%) | 0 (0.0%) |
| 65 to 69 Years | 44 (6.0%) | 0 (0.0%) |
| 70 to 74 Years | 47 (6.4%) | 44 (8.3%) |
| 75 to 79 Years | 0 (0.0%) | 0 (0.0%) |
| 80 to 84 Years | 0 (0.0%) | 31 (5.8%) |
| 85 Years and over | 0 (0.0%) | 0 (0.0%) |
| Total | 730 (100.0%) | 531 (100.0%) |
Families and Households in Tiburones
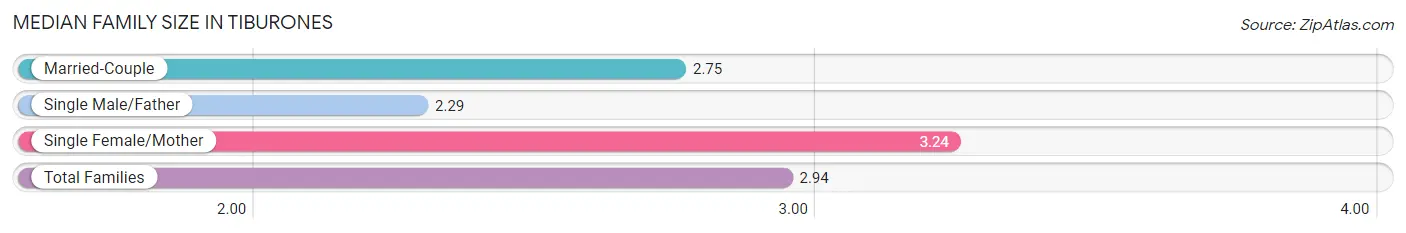
Median Family Size in Tiburones
The median family size in Tiburones is 2.94 persons per family, with single female/mother families (176 | 48.9%) accounting for the largest median family size of 3.24 persons per family. On the other hand, single male/father families (34 | 9.4%) represent the smallest median family size with 2.29 persons per family.
| Family Type | # Families | Family Size |
| Married-Couple | 150 (41.7%) | 2.75 |
| Single Male/Father | 34 (9.4%) | 2.29 |
| Single Female/Mother | 176 (48.9%) | 3.24 |
| Total Families | 360 (100.0%) | 2.94 |
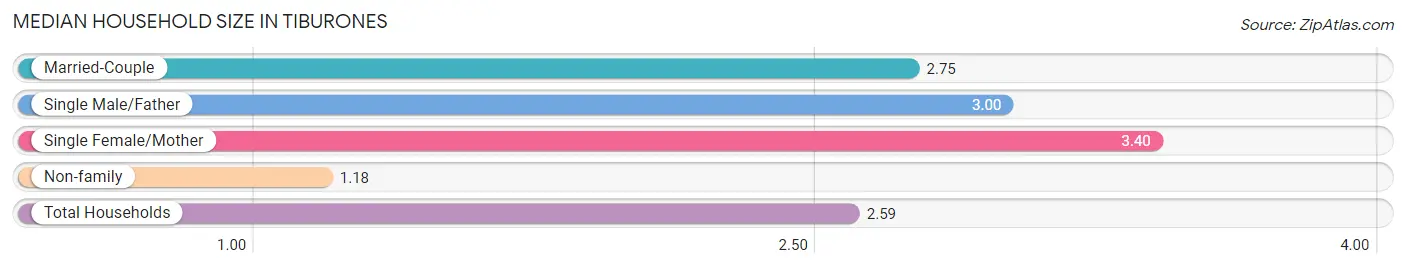
Median Household Size in Tiburones
The median household size in Tiburones is 2.59 persons per household, with single female/mother households (176 | 36.2%) accounting for the largest median household size of 3.4 persons per household. non-family households (126 | 25.9%) represent the smallest median household size with 1.18 persons per household.
| Household Type | # Households | Household Size |
| Married-Couple | 150 (30.9%) | 2.75 |
| Single Male/Father | 34 (7.0%) | 3.00 |
| Single Female/Mother | 176 (36.2%) | 3.40 |
| Non-family | 126 (25.9%) | 1.18 |
| Total Households | 486 (100.0%) | 2.59 |
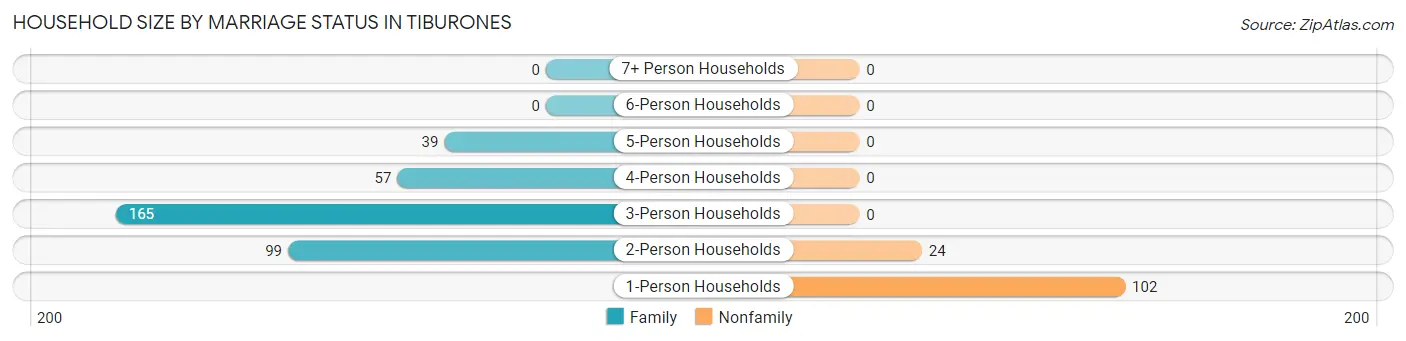
Household Size by Marriage Status in Tiburones
Out of a total of 486 households in Tiburones, 360 (74.1%) are family households, while 126 (25.9%) are nonfamily households. The most numerous type of family households are 3-person households, comprising 165, and the most common type of nonfamily households are 1-person households, comprising 102.
| Household Size | Family Households | Nonfamily Households |
| 1-Person Households | - | 102 (21.0%) |
| 2-Person Households | 99 (20.4%) | 24 (4.9%) |
| 3-Person Households | 165 (34.0%) | 0 (0.0%) |
| 4-Person Households | 57 (11.7%) | 0 (0.0%) |
| 5-Person Households | 39 (8.0%) | 0 (0.0%) |
| 6-Person Households | 0 (0.0%) | 0 (0.0%) |
| 7+ Person Households | 0 (0.0%) | 0 (0.0%) |
| Total | 360 (74.1%) | 126 (25.9%) |
Female Fertility in Tiburones
Fertility by Age in Tiburones
| Age Bracket | Women with Births | Births / 1,000 Women |
| 15 to 19 years | 0 (0.0%) | 0.0 |
| 20 to 34 years | 0 (0.0%) | 0.0 |
| 35 to 50 years | 0 (0.0%) | 0.0 |
| Total | 0 (0.0%) | 0.0 |
Fertility by Age by Marriage Status in Tiburones
| Age Bracket | Married | Unmarried |
| 15 to 19 years | 0 (0.0%) | 0 (0.0%) |
| 20 to 34 years | 0 (0.0%) | 0 (0.0%) |
| 35 to 50 years | 0 (0.0%) | 0 (0.0%) |
| Total | 0 (0.0%) | 0 (0.0%) |
Fertility by Education in Tiburones
| Educational Attainment | Women with Births | Births / 1,000 Women |
| Less than High School | 0 (0.0%) | 0.0 |
| High School Diploma | 0 (0.0%) | 0.0 |
| College or Associate's Degree | 0 (0.0%) | 0.0 |
| Bachelor's Degree | 0 (0.0%) | 0.0 |
| Graduate Degree | 0 (0.0%) | 0.0 |
| Total | 0 (0.0%) | 0.0 |
Fertility by Education by Marriage Status in Tiburones
| Educational Attainment | Married | Unmarried |
| Less than High School | 0 (0.0%) | 0 (0.0%) |
| High School Diploma | 0 (0.0%) | 0 (0.0%) |
| College or Associate's Degree | 0 (0.0%) | 0 (0.0%) |
| Bachelor's Degree | 0 (0.0%) | 0 (0.0%) |
| Graduate Degree | 0 (0.0%) | 0 (0.0%) |
| Total | 0 (0.0%) | 0 (0.0%) |
Employment Characteristics in Tiburones
Employment by Class of Employer in Tiburones
Among the 243 employed individuals in Tiburones, private company employees (107 | 44.0%), local government employees (72 | 29.6%), and self-employed (not incorporated) (39 | 16.1%) make up the most common classes of employment.
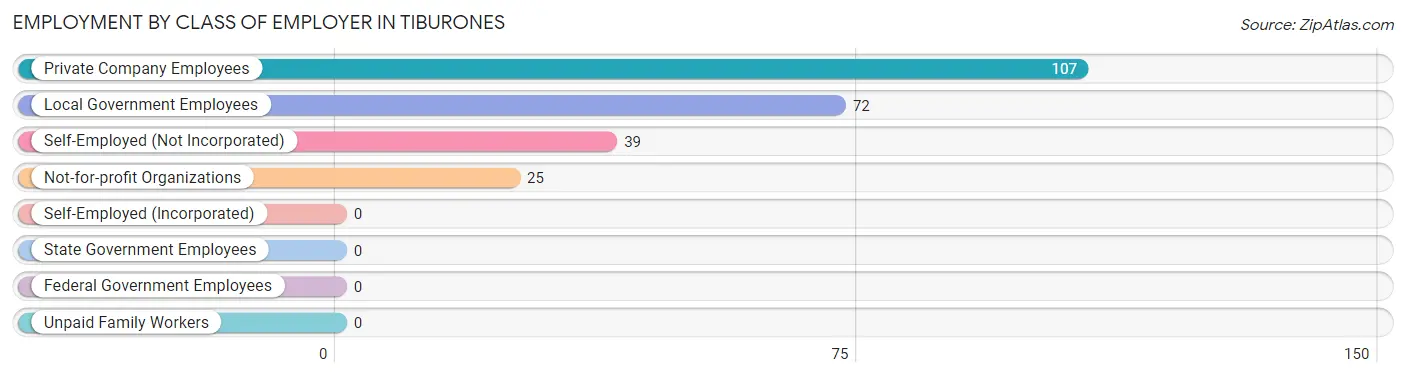
| Employer Class | # Employees | % Employees |
| Private Company Employees | 107 | 44.0% |
| Self-Employed (Incorporated) | 0 | 0.0% |
| Self-Employed (Not Incorporated) | 39 | 16.1% |
| Not-for-profit Organizations | 25 | 10.3% |
| Local Government Employees | 72 | 29.6% |
| State Government Employees | 0 | 0.0% |
| Federal Government Employees | 0 | 0.0% |
| Unpaid Family Workers | 0 | 0.0% |
| Total | 243 | 100.0% |
Employment Status by Age in Tiburones
According to the labor force statistics for Tiburones, out of the total population over 16 years of age (964), 41.4% or 399 individuals are in the labor force, with 39.1% or 156 of them unemployed. The age group with the highest labor force participation rate is 25 to 29 years, with 100.0% or 85 individuals in the labor force. Within the labor force, the 20 to 24 years age range has the highest percentage of unemployed individuals, with 100.0% or 44 of them being unemployed.
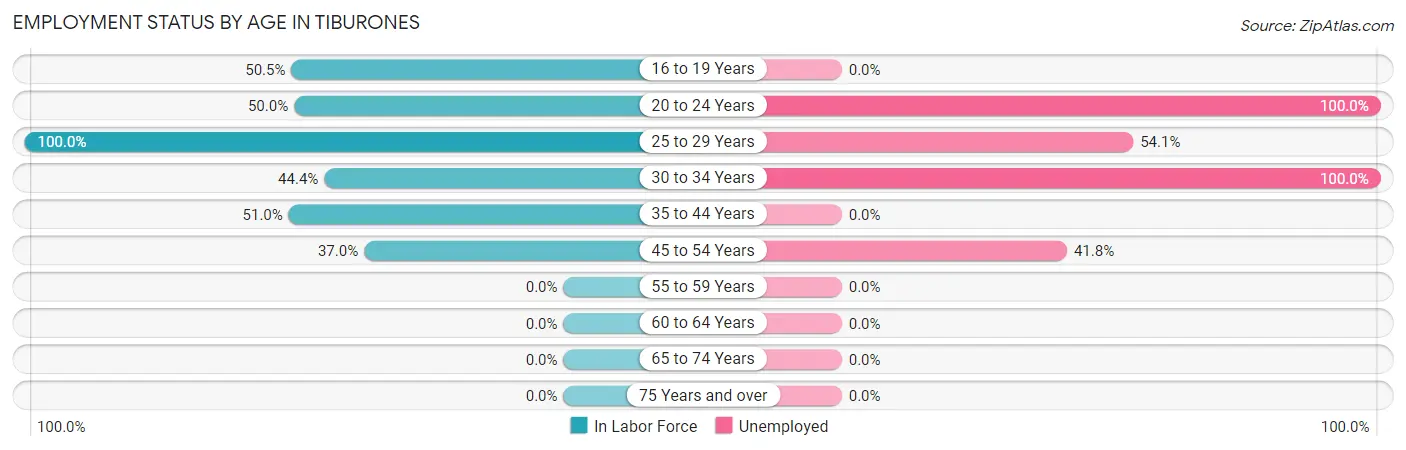
| Age Bracket | In Labor Force | Unemployed |
| 16 to 19 Years | 47 (50.5%) | 0 (0.0%) |
| 20 to 24 Years | 44 (50.0%) | 44 (100.0%) |
| 25 to 29 Years | 85 (100.0%) | 46 (54.1%) |
| 30 to 34 Years | 28 (44.4%) | 28 (100.0%) |
| 35 to 44 Years | 104 (51.0%) | 0 (0.0%) |
| 45 to 54 Years | 91 (37.0%) | 38 (41.8%) |
| 55 to 59 Years | 0 (0.0%) | 0 (0.0%) |
| 60 to 64 Years | 0 (0.0%) | 0 (0.0%) |
| 65 to 74 Years | 0 (0.0%) | 0 (0.0%) |
| 75 Years and over | 0 (0.0%) | 0 (0.0%) |
| Total | 399 (41.4%) | 156 (39.1%) |
Employment Status by Educational Attainment in Tiburones
According to labor force statistics for Tiburones, 49.9% of individuals (308) out of the total population between 25 and 64 years of age (617) are in the labor force, with 36.4% or 112 of them being unemployed. The group with the highest labor force participation rate are those with the educational attainment of high school diploma, with 69.0% or 211 individuals in the labor force. Within the labor force, individuals with high school diploma education have the highest percentage of unemployment, with 53.1% or 112 of them being unemployed.
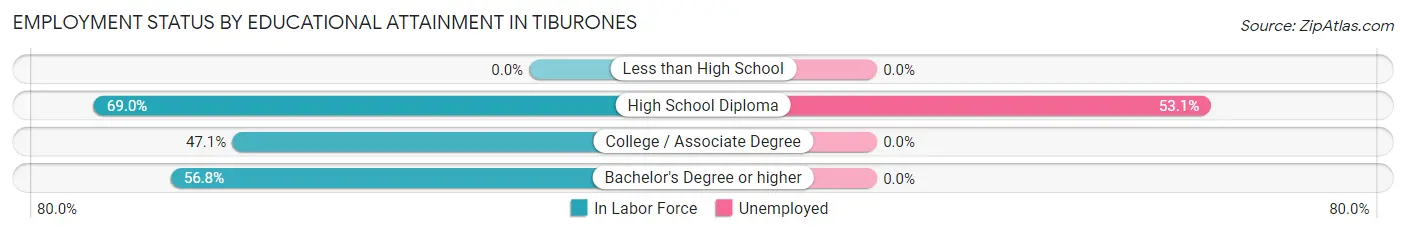
| Educational Attainment | In Labor Force | Unemployed |
| Less than High School | 0 (0.0%) | 0 (0.0%) |
| High School Diploma | 211 (69.0%) | 162 (53.1%) |
| College / Associate Degree | 72 (47.1%) | 0 (0.0%) |
| Bachelor's Degree or higher | 25 (56.8%) | 0 (0.0%) |
| Total | 308 (49.9%) | 225 (36.4%) |
Employment Occupations by Sex in Tiburones
Management, Business, Science and Arts Occupations
Management, Business, Science and Arts Occupations by Sex
| Occupation | Male | Female |
| Management | 0 (0.0%) | 0 (0.0%) |
| Business & Financial | 0 (0.0%) | 0 (0.0%) |
| Computers, Engineering & Science | 0 (0.0%) | 0 (0.0%) |
| Computers & Mathematics | 0 (0.0%) | 0 (0.0%) |
| Architecture & Engineering | 0 (0.0%) | 0 (0.0%) |
| Life, Physical & Social Science | 0 (0.0%) | 0 (0.0%) |
| Community & Social Service | 0 (0.0%) | 0 (0.0%) |
| Education, Arts & Media | 0 (0.0%) | 0 (0.0%) |
| Legal Services & Support | 0 (0.0%) | 0 (0.0%) |
| Education Instruction & Library | 0 (0.0%) | 0 (0.0%) |
| Arts, Media & Entertainment | 0 (0.0%) | 0 (0.0%) |
| Health Diagnosing & Treating | 0 (0.0%) | 0 (0.0%) |
| Health Technologists | 0 (0.0%) | 0 (0.0%) |
| Total (Category) | 0 (0.0%) | 0 (0.0%) |
| Total (Overall) | 85 (35.0%) | 158 (65.0%) |
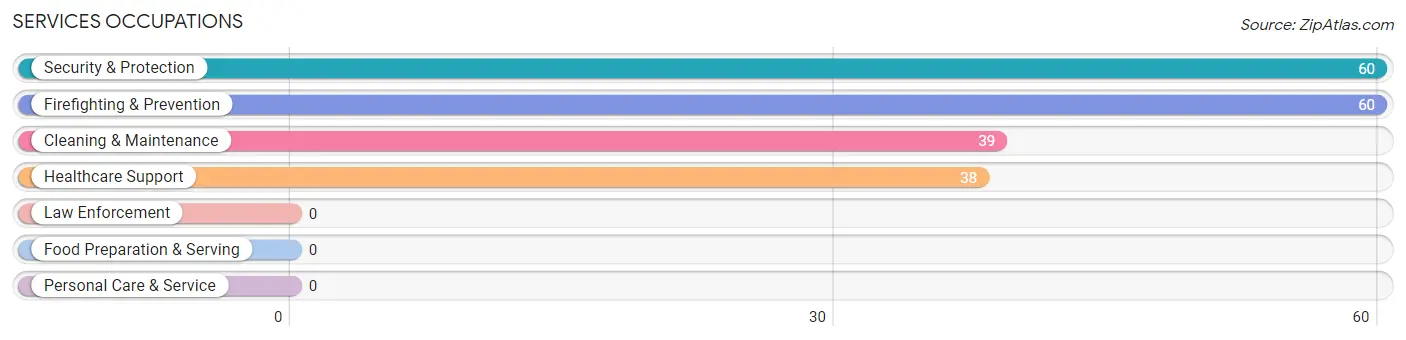
Services Occupations
The most common Services occupations in Tiburones are Security & Protection (60 | 24.7%), Firefighting & Prevention (60 | 24.7%), Cleaning & Maintenance (39 | 16.1%), and Healthcare Support (38 | 15.6%).
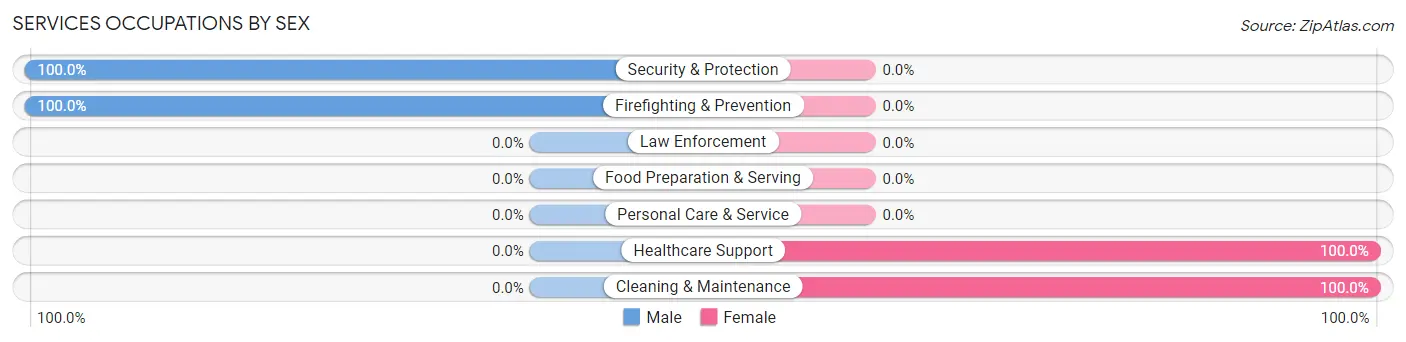
Services Occupations by Sex
Within the Services occupations in Tiburones, the most male-oriented occupations are Security & Protection (100.0%), and Firefighting & Prevention (100.0%), while the most female-oriented occupations are Healthcare Support (100.0%), and Cleaning & Maintenance (100.0%).
| Occupation | Male | Female |
| Healthcare Support | 0 (0.0%) | 38 (100.0%) |
| Security & Protection | 60 (100.0%) | 0 (0.0%) |
| Firefighting & Prevention | 60 (100.0%) | 0 (0.0%) |
| Law Enforcement | 0 (0.0%) | 0 (0.0%) |
| Food Preparation & Serving | 0 (0.0%) | 0 (0.0%) |
| Cleaning & Maintenance | 0 (0.0%) | 39 (100.0%) |
| Personal Care & Service | 0 (0.0%) | 0 (0.0%) |
| Total (Category) | 60 (43.8%) | 77 (56.2%) |
| Total (Overall) | 85 (35.0%) | 158 (65.0%) |
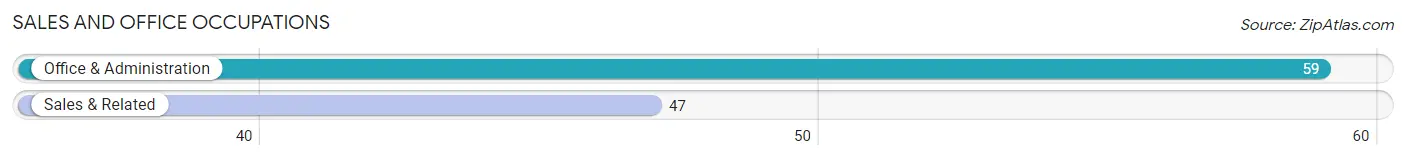
Sales and Office Occupations
The most common Sales and Office occupations in Tiburones are Office & Administration (59 | 24.3%), and Sales & Related (47 | 19.3%).
Sales and Office Occupations by Sex
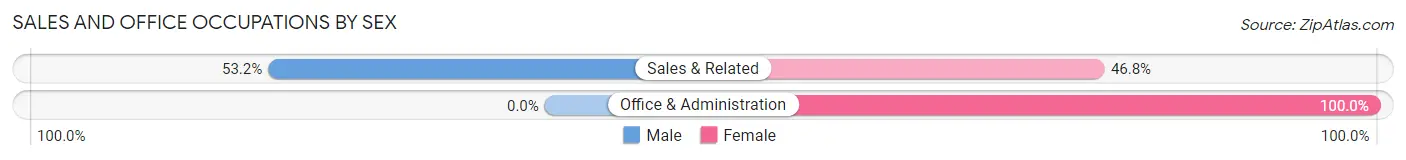
| Occupation | Male | Female |
| Sales & Related | 25 (53.2%) | 22 (46.8%) |
| Office & Administration | 0 (0.0%) | 59 (100.0%) |
| Total (Category) | 25 (23.6%) | 81 (76.4%) |
| Total (Overall) | 85 (35.0%) | 158 (65.0%) |
Natural Resources, Construction and Maintenance Occupations
Natural Resources, Construction and Maintenance Occupations by Sex
| Occupation | Male | Female |
| Farming, Fishing & Forestry | 0 (0.0%) | 0 (0.0%) |
| Construction & Extraction | 0 (0.0%) | 0 (0.0%) |
| Installation, Maintenance & Repair | 0 (0.0%) | 0 (0.0%) |
| Total (Category) | 0 (0.0%) | 0 (0.0%) |
| Total (Overall) | 85 (35.0%) | 158 (65.0%) |
Production, Transportation and Moving Occupations
Production, Transportation and Moving Occupations by Sex
| Occupation | Male | Female |
| Production | 0 (0.0%) | 0 (0.0%) |
| Transportation | 0 (0.0%) | 0 (0.0%) |
| Material Moving | 0 (0.0%) | 0 (0.0%) |
| Total (Category) | 0 (0.0%) | 0 (0.0%) |
| Total (Overall) | 85 (35.0%) | 158 (65.0%) |
Employment Industries by Sex in Tiburones
Employment Industries in Tiburones
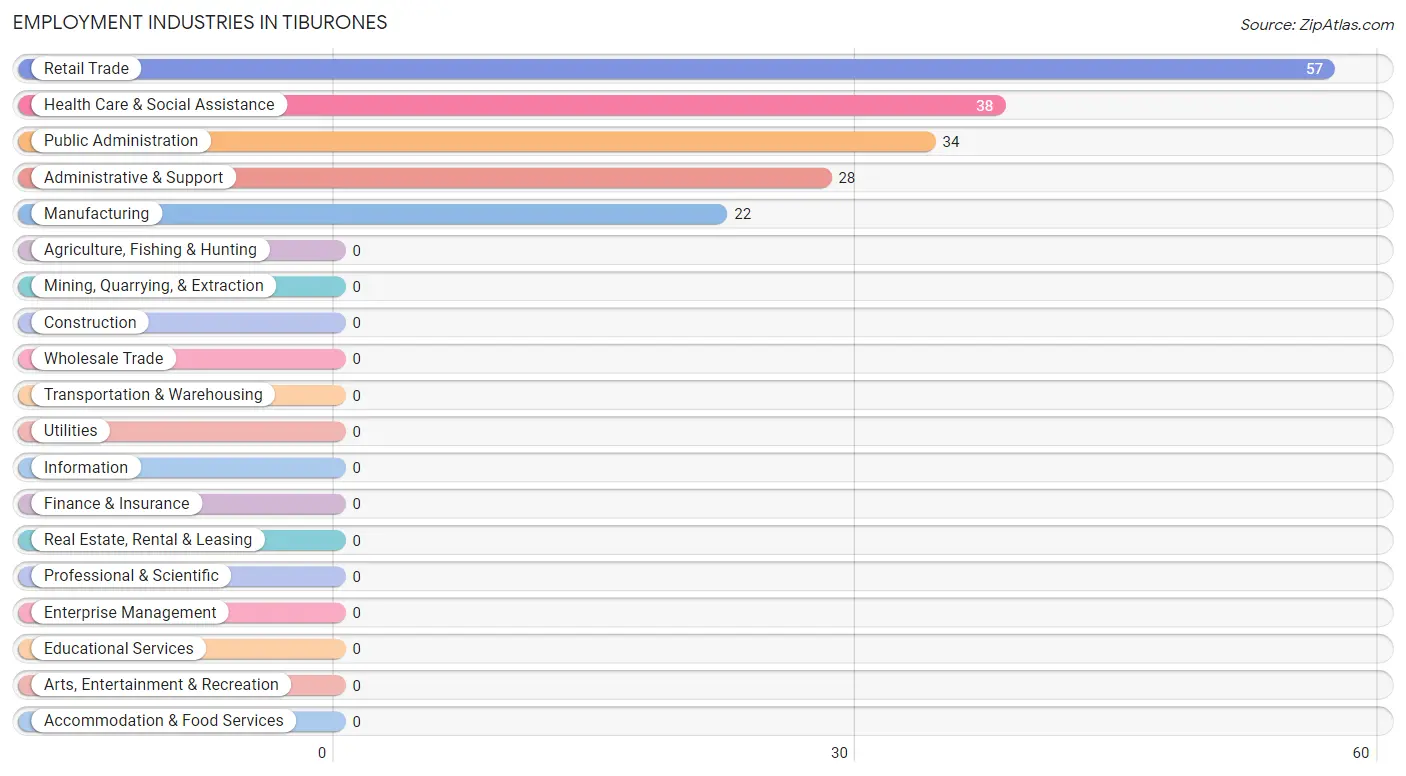
The major employment industries in Tiburones include Retail Trade (57 | 23.5%), Health Care & Social Assistance (38 | 15.6%), Public Administration (34 | 14.0%), Administrative & Support (28 | 11.5%), and Manufacturing (22 | 9.0%).
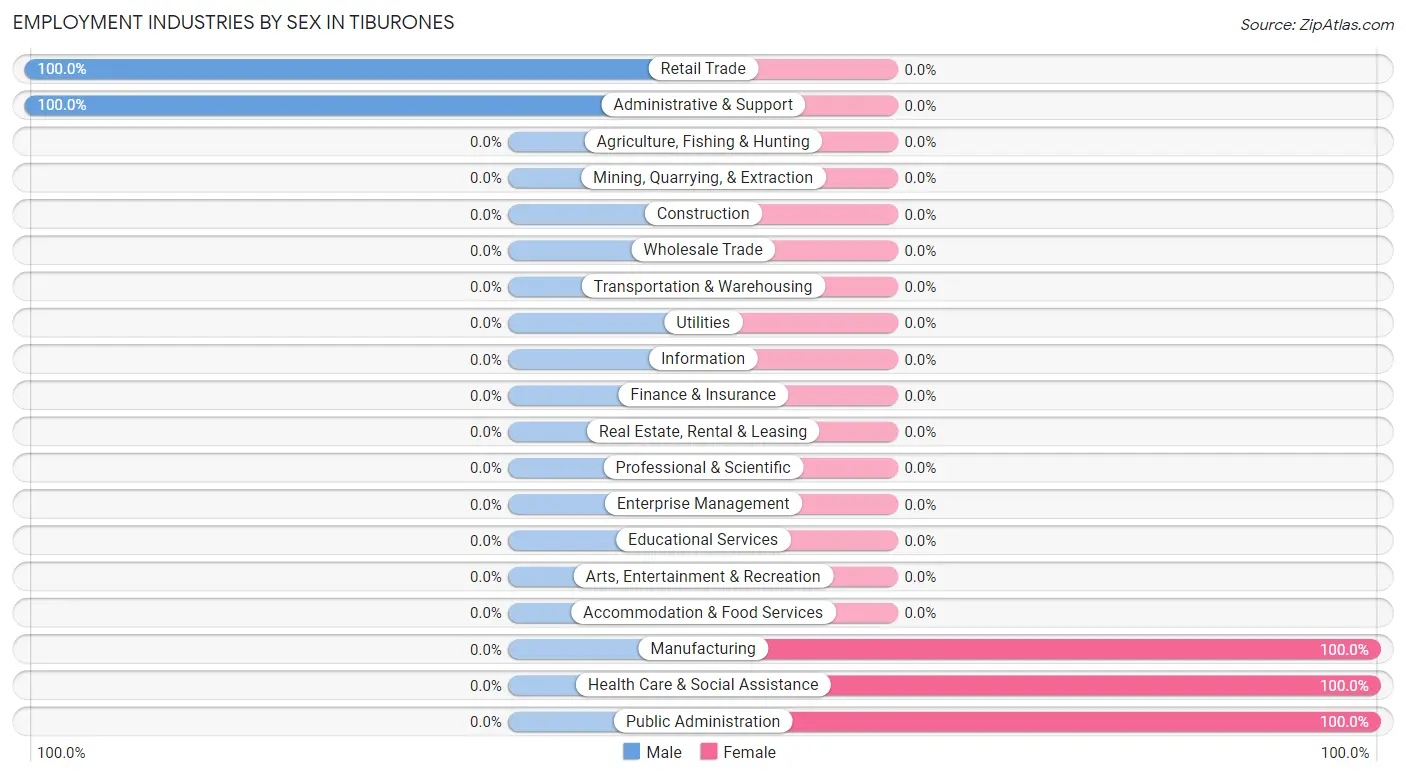
Employment Industries by Sex in Tiburones
The Tiburones industries that see more men than women are Retail Trade (100.0%), and Administrative & Support (100.0%), whereas the industries that tend to have a higher number of women are Manufacturing (100.0%), Health Care & Social Assistance (100.0%), and Public Administration (100.0%).
| Industry | Male | Female |
| Agriculture, Fishing & Hunting | 0 (0.0%) | 0 (0.0%) |
| Mining, Quarrying, & Extraction | 0 (0.0%) | 0 (0.0%) |
| Construction | 0 (0.0%) | 0 (0.0%) |
| Manufacturing | 0 (0.0%) | 22 (100.0%) |
| Wholesale Trade | 0 (0.0%) | 0 (0.0%) |
| Retail Trade | 57 (100.0%) | 0 (0.0%) |
| Transportation & Warehousing | 0 (0.0%) | 0 (0.0%) |
| Utilities | 0 (0.0%) | 0 (0.0%) |
| Information | 0 (0.0%) | 0 (0.0%) |
| Finance & Insurance | 0 (0.0%) | 0 (0.0%) |
| Real Estate, Rental & Leasing | 0 (0.0%) | 0 (0.0%) |
| Professional & Scientific | 0 (0.0%) | 0 (0.0%) |
| Enterprise Management | 0 (0.0%) | 0 (0.0%) |
| Administrative & Support | 28 (100.0%) | 0 (0.0%) |
| Educational Services | 0 (0.0%) | 0 (0.0%) |
| Health Care & Social Assistance | 0 (0.0%) | 38 (100.0%) |
| Arts, Entertainment & Recreation | 0 (0.0%) | 0 (0.0%) |
| Accommodation & Food Services | 0 (0.0%) | 0 (0.0%) |
| Public Administration | 0 (0.0%) | 34 (100.0%) |
| Total | 85 (35.0%) | 158 (65.0%) |
Education in Tiburones
School Enrollment in Tiburones
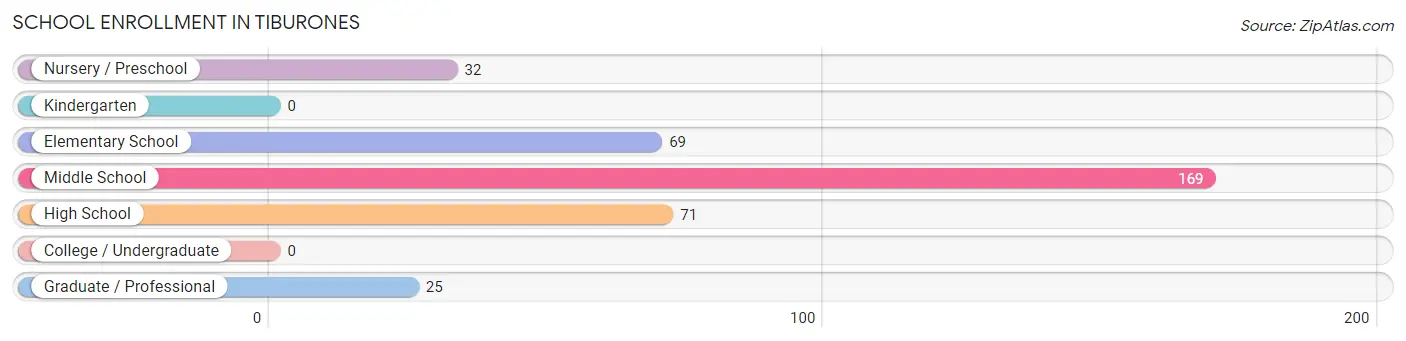
The most common levels of schooling among the 366 students in Tiburones are middle school (169 | 46.2%), high school (71 | 19.4%), and elementary school (69 | 18.9%).
| School Level | # Students | % Students |
| Nursery / Preschool | 32 | 8.7% |
| Kindergarten | 0 | 0.0% |
| Elementary School | 69 | 18.9% |
| Middle School | 169 | 46.2% |
| High School | 71 | 19.4% |
| College / Undergraduate | 0 | 0.0% |
| Graduate / Professional | 25 | 6.8% |
| Total | 366 | 100.0% |
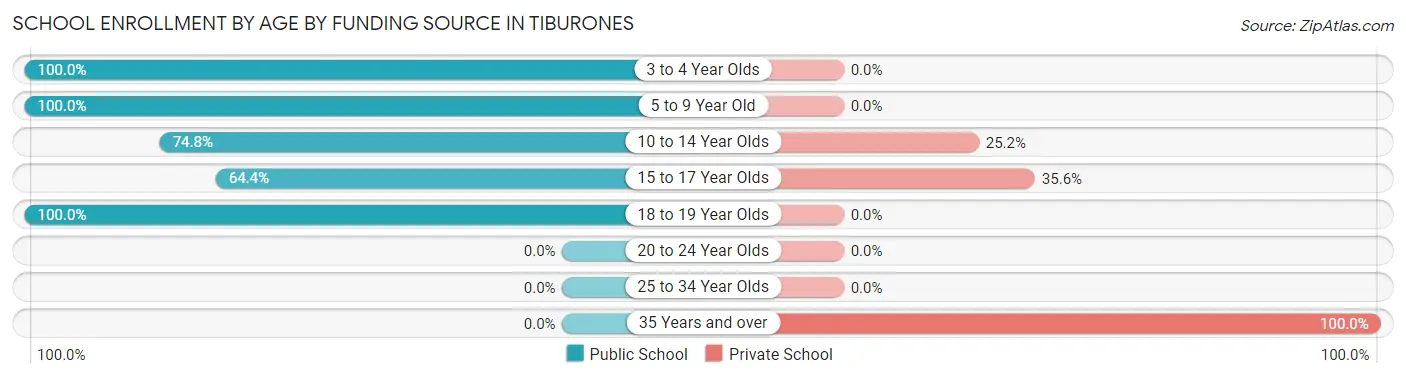
School Enrollment by Age by Funding Source in Tiburones
Out of a total of 366 students who are enrolled in schools in Tiburones, 87 (23.8%) attend a private institution, while the remaining 279 (76.2%) are enrolled in public schools. The age group of 35 years and over has the highest likelihood of being enrolled in private schools, with 25 (100.0% in the age bracket) enrolled. Conversely, the age group of 3 to 4 year olds has the lowest likelihood of being enrolled in a private school, with 32 (100.0% in the age bracket) attending a public institution.
| Age Bracket | Public School | Private School |
| 3 to 4 Year Olds | 32 (100.0%) | 0 (0.0%) |
| 5 to 9 Year Old | 69 (100.0%) | 0 (0.0%) |
| 10 to 14 Year Olds | 107 (74.8%) | 36 (25.2%) |
| 15 to 17 Year Olds | 47 (64.4%) | 26 (35.6%) |
| 18 to 19 Year Olds | 24 (100.0%) | 0 (0.0%) |
| 20 to 24 Year Olds | 0 (0.0%) | 0 (0.0%) |
| 25 to 34 Year Olds | 0 (0.0%) | 0 (0.0%) |
| 35 Years and over | 0 (0.0%) | 25 (100.0%) |
| Total | 279 (76.2%) | 87 (23.8%) |
Educational Attainment by Field of Study in Tiburones
Bio, nature & agricultural (25 | 36.2%), liberal arts & history (25 | 36.2%), and education (19 | 27.5%) are the most common fields of study among 69 individuals in Tiburones who have obtained a bachelor's degree or higher.
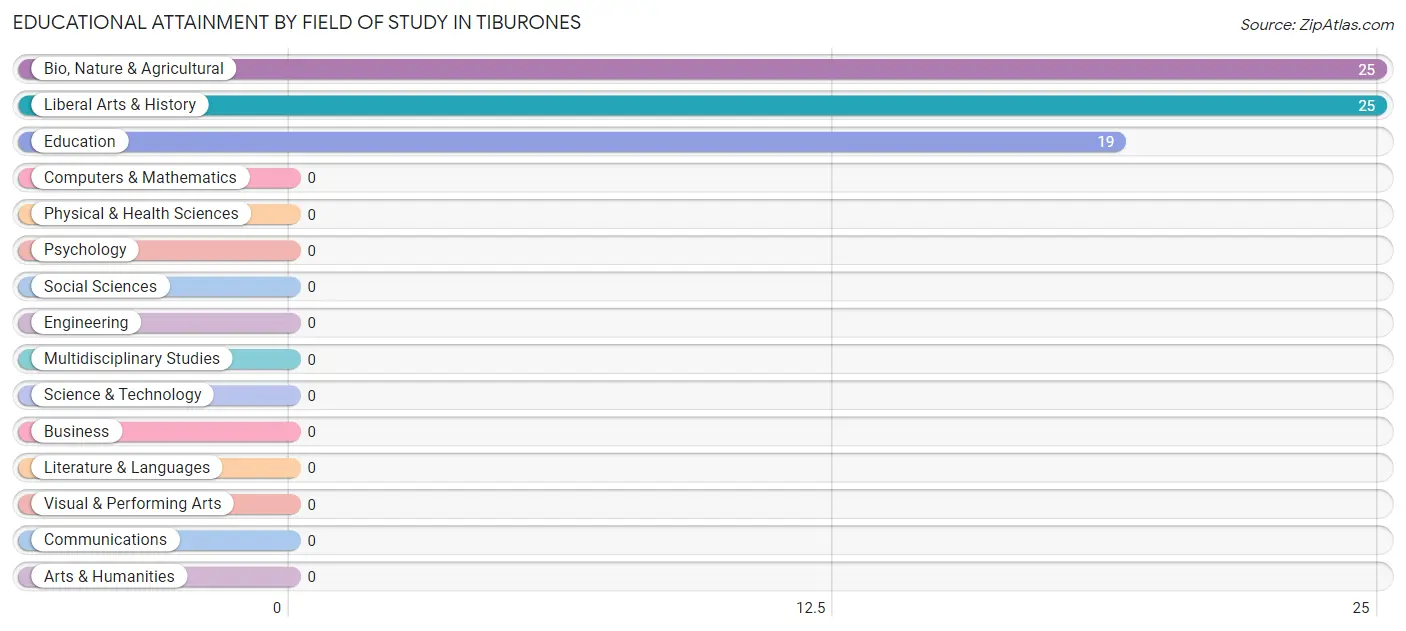
| Field of Study | # Graduates | % Graduates |
| Computers & Mathematics | 0 | 0.0% |
| Bio, Nature & Agricultural | 25 | 36.2% |
| Physical & Health Sciences | 0 | 0.0% |
| Psychology | 0 | 0.0% |
| Social Sciences | 0 | 0.0% |
| Engineering | 0 | 0.0% |
| Multidisciplinary Studies | 0 | 0.0% |
| Science & Technology | 0 | 0.0% |
| Business | 0 | 0.0% |
| Education | 19 | 27.5% |
| Literature & Languages | 0 | 0.0% |
| Liberal Arts & History | 25 | 36.2% |
| Visual & Performing Arts | 0 | 0.0% |
| Communications | 0 | 0.0% |
| Arts & Humanities | 0 | 0.0% |
| Total | 69 | 100.0% |
Transportation & Commute in Tiburones
Vehicle Availability by Sex in Tiburones
The most prevalent vehicle ownership categories in Tiburones are males with 3 vehicles (32, accounting for 37.7%) and females with 3 vehicles (73, making up 20.3%).
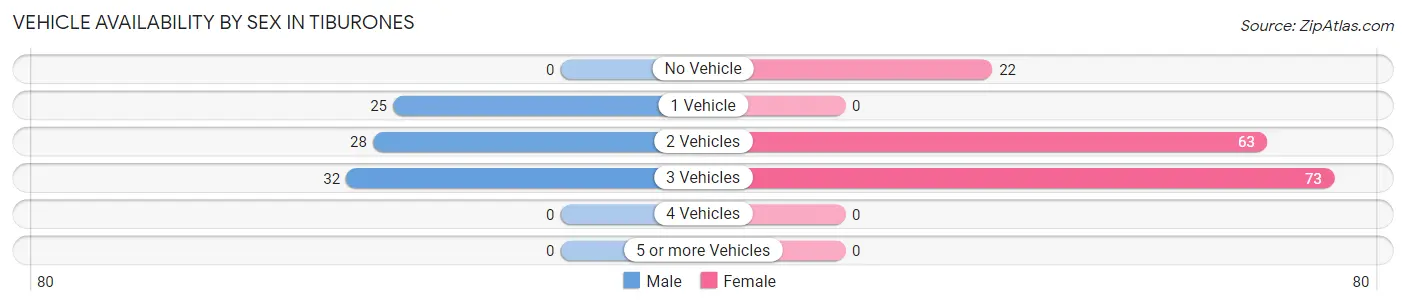
| Vehicles Available | Male | Female |
| No Vehicle | 0 (0.0%) | 22 (13.9%) |
| 1 Vehicle | 25 (29.4%) | 0 (0.0%) |
| 2 Vehicles | 28 (32.9%) | 63 (39.9%) |
| 3 Vehicles | 32 (37.7%) | 73 (46.2%) |
| 4 Vehicles | 0 (0.0%) | 0 (0.0%) |
| 5 or more Vehicles | 0 (0.0%) | 0 (0.0%) |
| Total | 85 (100.0%) | 158 (100.0%) |
Commute Time in Tiburones
The most frequently occuring commute durations in Tiburones are 25 to 29 minutes (61 commuters, 25.1%), less than 5 minutes (38 commuters, 15.6%), and 10 to 14 minutes (34 commuters, 14.0%).
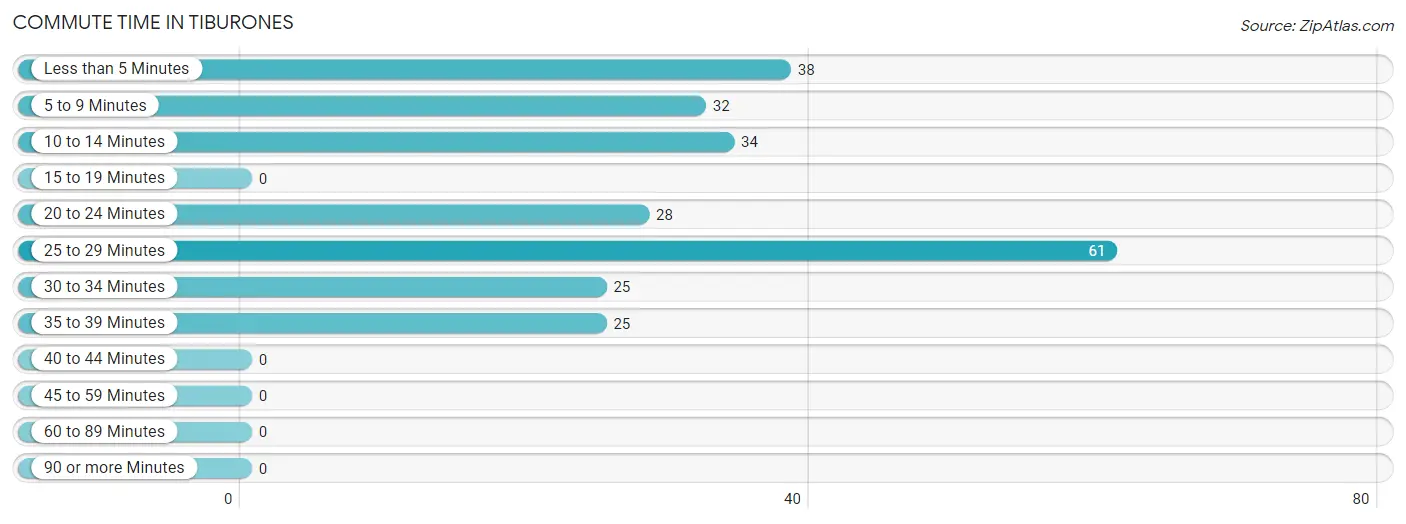
| Commute Time | # Commuters | % Commuters |
| Less than 5 Minutes | 38 | 15.6% |
| 5 to 9 Minutes | 32 | 13.2% |
| 10 to 14 Minutes | 34 | 14.0% |
| 15 to 19 Minutes | 0 | 0.0% |
| 20 to 24 Minutes | 28 | 11.5% |
| 25 to 29 Minutes | 61 | 25.1% |
| 30 to 34 Minutes | 25 | 10.3% |
| 35 to 39 Minutes | 25 | 10.3% |
| 40 to 44 Minutes | 0 | 0.0% |
| 45 to 59 Minutes | 0 | 0.0% |
| 60 to 89 Minutes | 0 | 0.0% |
| 90 or more Minutes | 0 | 0.0% |
Commute Time by Sex in Tiburones
The most common commute times in Tiburones are 5 to 9 minutes (32 commuters, 37.7%) for males and 25 to 29 minutes (61 commuters, 38.6%) for females.
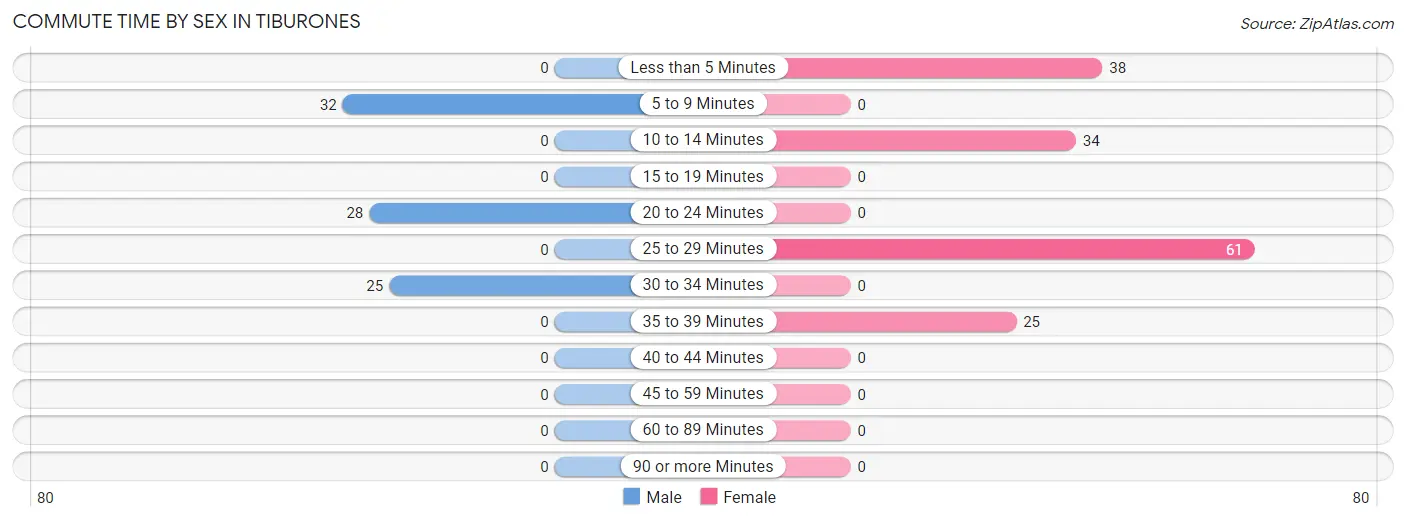
| Commute Time | Male | Female |
| Less than 5 Minutes | 0 (0.0%) | 38 (24.0%) |
| 5 to 9 Minutes | 32 (37.7%) | 0 (0.0%) |
| 10 to 14 Minutes | 0 (0.0%) | 34 (21.5%) |
| 15 to 19 Minutes | 0 (0.0%) | 0 (0.0%) |
| 20 to 24 Minutes | 28 (32.9%) | 0 (0.0%) |
| 25 to 29 Minutes | 0 (0.0%) | 61 (38.6%) |
| 30 to 34 Minutes | 25 (29.4%) | 0 (0.0%) |
| 35 to 39 Minutes | 0 (0.0%) | 25 (15.8%) |
| 40 to 44 Minutes | 0 (0.0%) | 0 (0.0%) |
| 45 to 59 Minutes | 0 (0.0%) | 0 (0.0%) |
| 60 to 89 Minutes | 0 (0.0%) | 0 (0.0%) |
| 90 or more Minutes | 0 (0.0%) | 0 (0.0%) |
Time of Departure to Work by Sex in Tiburones
The most frequent times of departure to work in Tiburones are 4:00 PM to 11:59 PM (60, 70.6%) for males and 7:30 AM to 7:59 AM (97, 61.4%) for females.
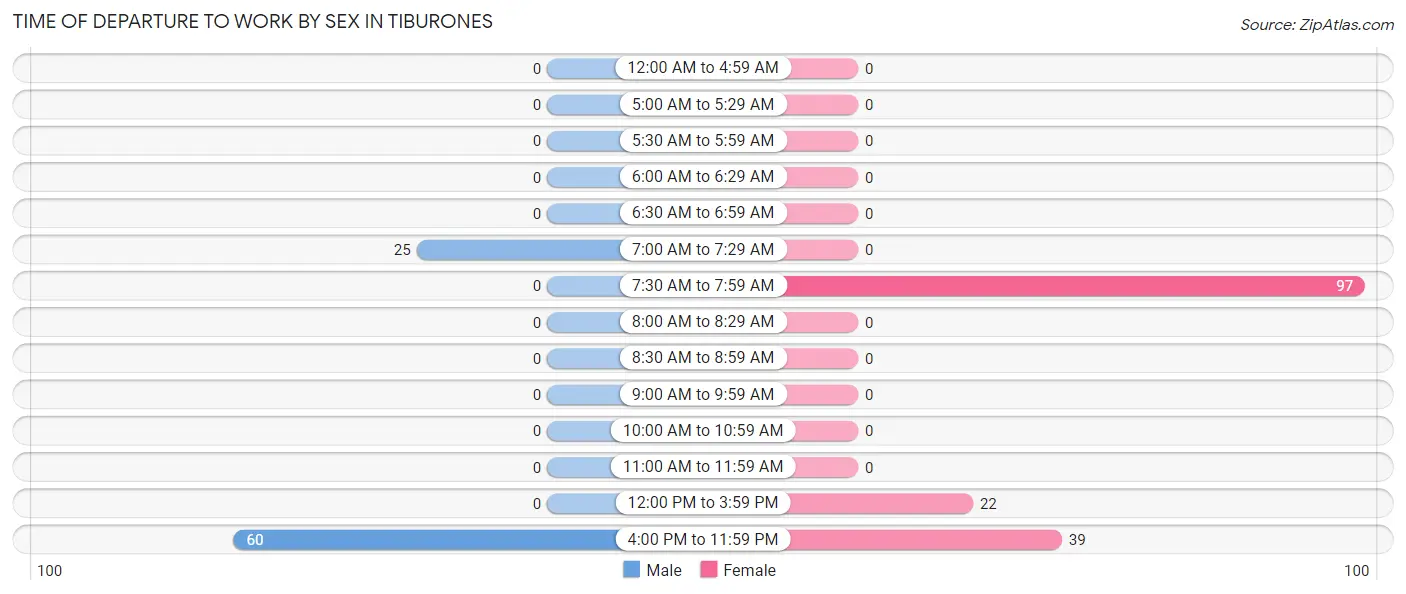
| Time of Departure | Male | Female |
| 12:00 AM to 4:59 AM | 0 (0.0%) | 0 (0.0%) |
| 5:00 AM to 5:29 AM | 0 (0.0%) | 0 (0.0%) |
| 5:30 AM to 5:59 AM | 0 (0.0%) | 0 (0.0%) |
| 6:00 AM to 6:29 AM | 0 (0.0%) | 0 (0.0%) |
| 6:30 AM to 6:59 AM | 0 (0.0%) | 0 (0.0%) |
| 7:00 AM to 7:29 AM | 25 (29.4%) | 0 (0.0%) |
| 7:30 AM to 7:59 AM | 0 (0.0%) | 97 (61.4%) |
| 8:00 AM to 8:29 AM | 0 (0.0%) | 0 (0.0%) |
| 8:30 AM to 8:59 AM | 0 (0.0%) | 0 (0.0%) |
| 9:00 AM to 9:59 AM | 0 (0.0%) | 0 (0.0%) |
| 10:00 AM to 10:59 AM | 0 (0.0%) | 0 (0.0%) |
| 11:00 AM to 11:59 AM | 0 (0.0%) | 0 (0.0%) |
| 12:00 PM to 3:59 PM | 0 (0.0%) | 22 (13.9%) |
| 4:00 PM to 11:59 PM | 60 (70.6%) | 39 (24.7%) |
| Total | 85 (100.0%) | 158 (100.0%) |
Housing Occupancy in Tiburones
Occupancy by Ownership in Tiburones
Of the total 486 dwellings in Tiburones, owner-occupied units account for 276 (56.8%), while renter-occupied units make up 210 (43.2%).
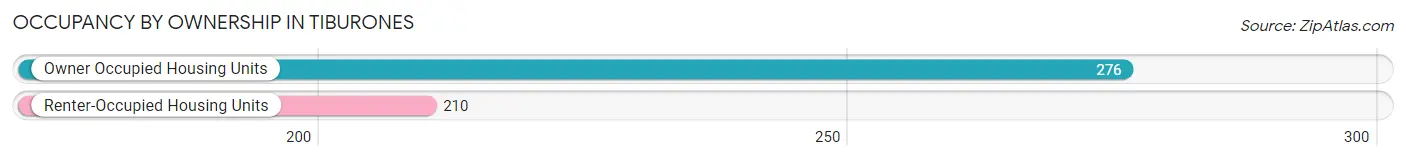
| Occupancy | # Housing Units | % Housing Units |
| Owner Occupied Housing Units | 276 | 56.8% |
| Renter-Occupied Housing Units | 210 | 43.2% |
| Total Occupied Housing Units | 486 | 100.0% |
Occupancy by Household Size in Tiburones
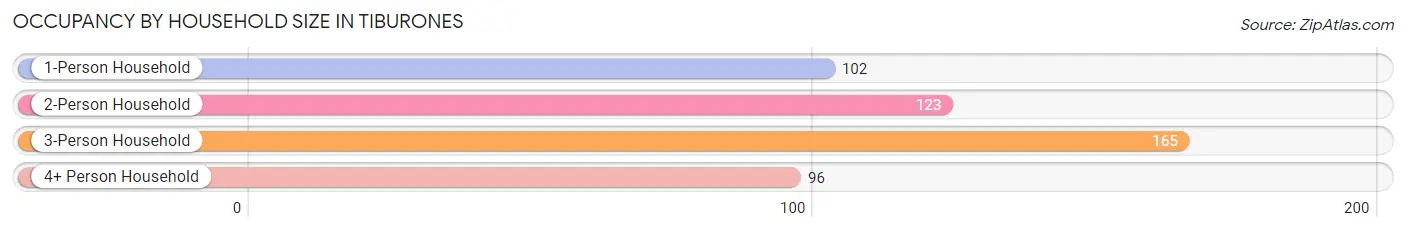
| Household Size | # Housing Units | % Housing Units |
| 1-Person Household | 102 | 21.0% |
| 2-Person Household | 123 | 25.3% |
| 3-Person Household | 165 | 34.0% |
| 4+ Person Household | 96 | 19.8% |
| Total Housing Units | 486 | 100.0% |
Occupancy by Ownership by Household Size in Tiburones
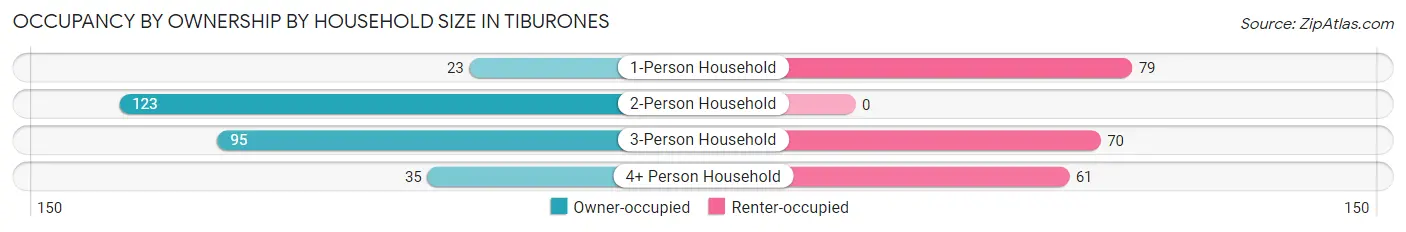
| Household Size | Owner-occupied | Renter-occupied |
| 1-Person Household | 23 (22.6%) | 79 (77.4%) |
| 2-Person Household | 123 (100.0%) | 0 (0.0%) |
| 3-Person Household | 95 (57.6%) | 70 (42.4%) |
| 4+ Person Household | 35 (36.5%) | 61 (63.5%) |
| Total Housing Units | 276 (56.8%) | 210 (43.2%) |
Occupancy by Educational Attainment in Tiburones
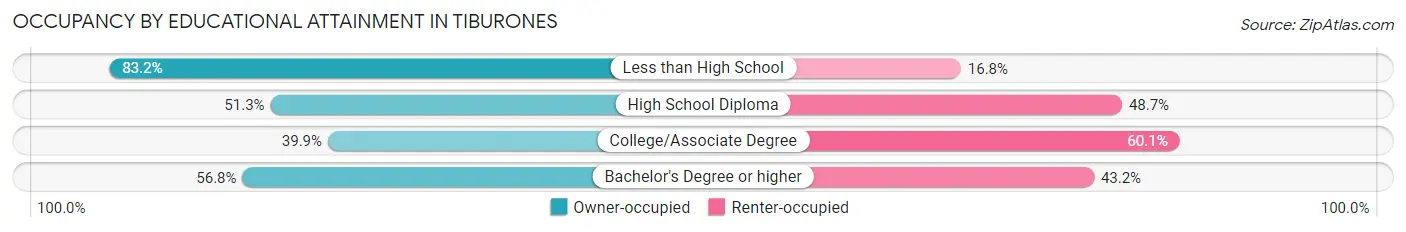
| Household Size | Owner-occupied | Renter-occupied |
| Less than High School | 109 (83.2%) | 22 (16.8%) |
| High School Diploma | 81 (51.3%) | 77 (48.7%) |
| College/Associate Degree | 61 (39.9%) | 92 (60.1%) |
| Bachelor's Degree or higher | 25 (56.8%) | 19 (43.2%) |
Occupancy by Age of Householder in Tiburones
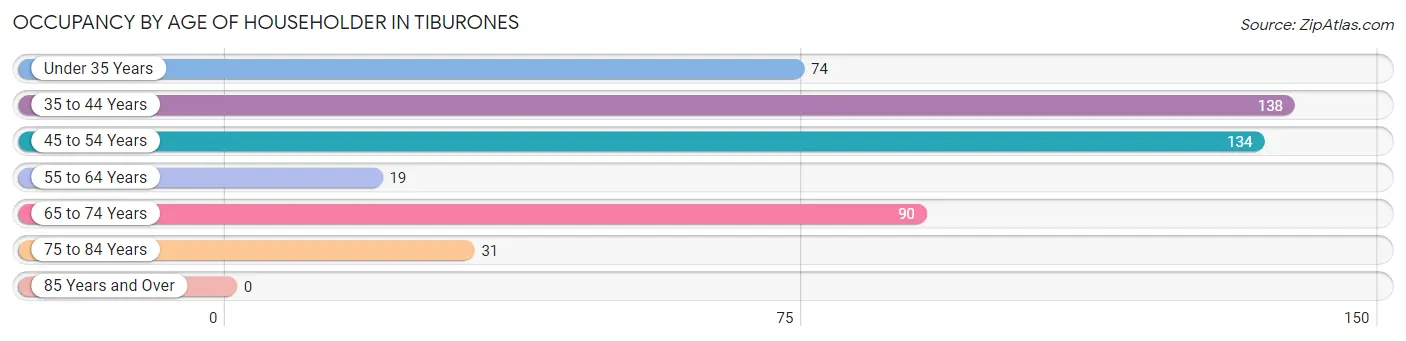
| Age Bracket | # Households | % Households |
| Under 35 Years | 74 | 15.2% |
| 35 to 44 Years | 138 | 28.4% |
| 45 to 54 Years | 134 | 27.6% |
| 55 to 64 Years | 19 | 3.9% |
| 65 to 74 Years | 90 | 18.5% |
| 75 to 84 Years | 31 | 6.4% |
| 85 Years and Over | 0 | 0.0% |
| Total | 486 | 100.0% |
Housing Finances in Tiburones
Median Income by Occupancy in Tiburones
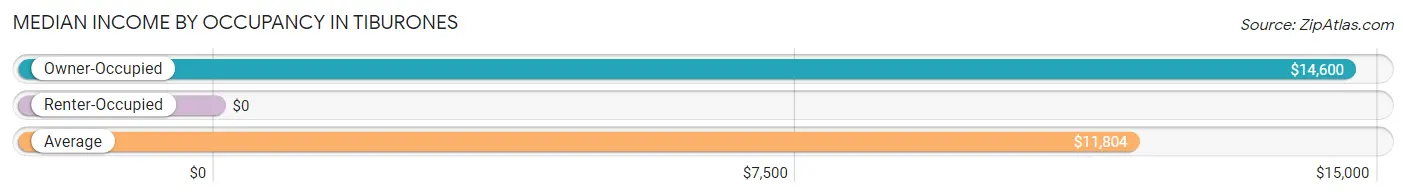
| Occupancy Type | # Households | Median Income |
| Owner-Occupied | 276 (56.8%) | $14,600 |
| Renter-Occupied | 210 (43.2%) | $0 |
| Average | 486 (100.0%) | $11,804 |
Occupancy by Householder Income Bracket in Tiburones
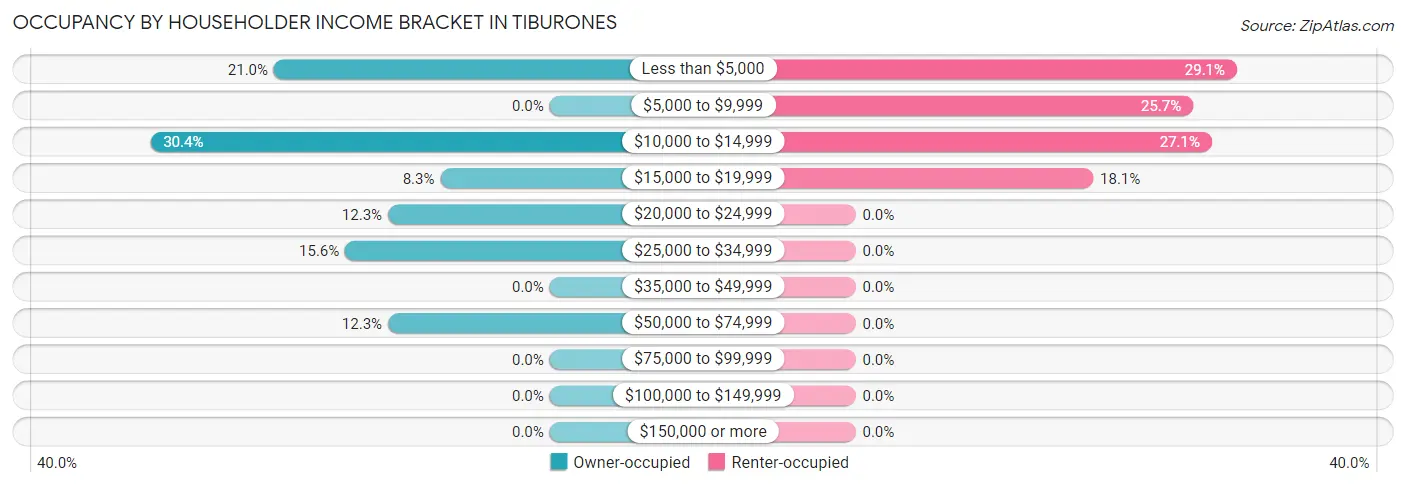
| Income Bracket | Owner-occupied | Renter-occupied |
| Less than $5,000 | 58 (21.0%) | 61 (29.0%) |
| $5,000 to $9,999 | 0 (0.0%) | 54 (25.7%) |
| $10,000 to $14,999 | 84 (30.4%) | 57 (27.1%) |
| $15,000 to $19,999 | 23 (8.3%) | 38 (18.1%) |
| $20,000 to $24,999 | 34 (12.3%) | 0 (0.0%) |
| $25,000 to $34,999 | 43 (15.6%) | 0 (0.0%) |
| $35,000 to $49,999 | 0 (0.0%) | 0 (0.0%) |
| $50,000 to $74,999 | 34 (12.3%) | 0 (0.0%) |
| $75,000 to $99,999 | 0 (0.0%) | 0 (0.0%) |
| $100,000 to $149,999 | 0 (0.0%) | 0 (0.0%) |
| $150,000 or more | 0 (0.0%) | 0 (0.0%) |
| Total | 276 (100.0%) | 210 (100.0%) |
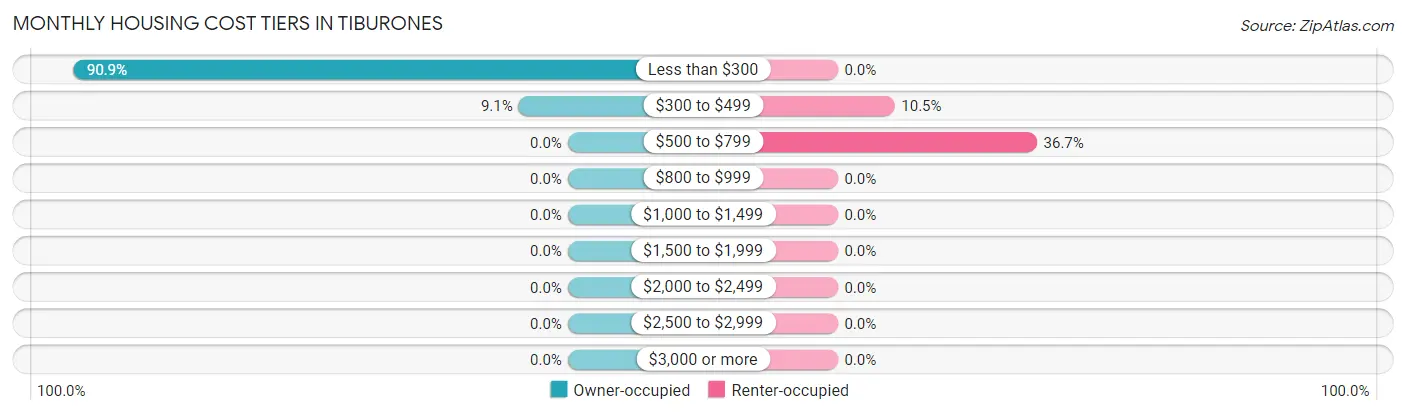
Monthly Housing Cost Tiers in Tiburones
| Monthly Cost | Owner-occupied | Renter-occupied |
| Less than $300 | 251 (90.9%) | 0 (0.0%) |
| $300 to $499 | 25 (9.1%) | 22 (10.5%) |
| $500 to $799 | 0 (0.0%) | 77 (36.7%) |
| $800 to $999 | 0 (0.0%) | 0 (0.0%) |
| $1,000 to $1,499 | 0 (0.0%) | 0 (0.0%) |
| $1,500 to $1,999 | 0 (0.0%) | 0 (0.0%) |
| $2,000 to $2,499 | 0 (0.0%) | 0 (0.0%) |
| $2,500 to $2,999 | 0 (0.0%) | 0 (0.0%) |
| $3,000 or more | 0 (0.0%) | 0 (0.0%) |
| Total | 276 (100.0%) | 210 (100.0%) |
Physical Housing Characteristics in Tiburones
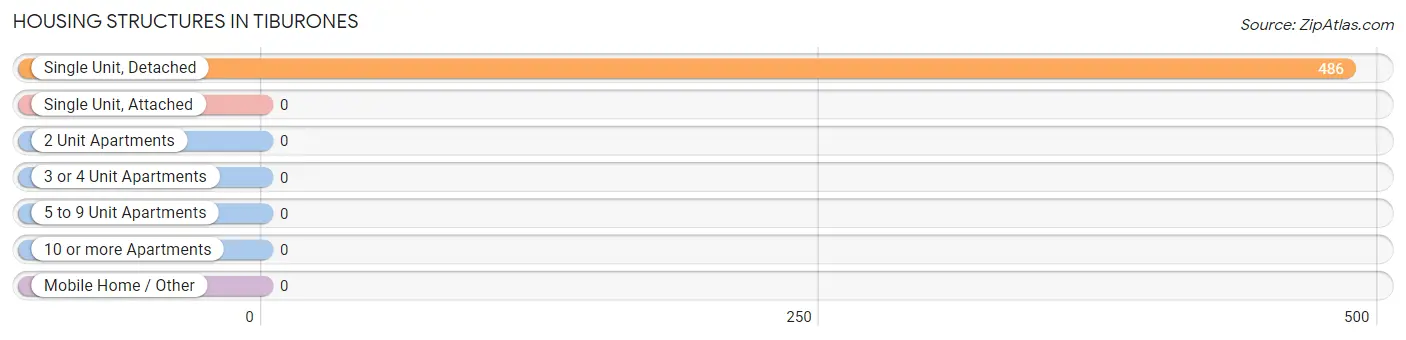
Housing Structures in Tiburones
| Structure Type | # Housing Units | % Housing Units |
| Single Unit, Detached | 486 | 100.0% |
| Single Unit, Attached | 0 | 0.0% |
| 2 Unit Apartments | 0 | 0.0% |
| 3 or 4 Unit Apartments | 0 | 0.0% |
| 5 to 9 Unit Apartments | 0 | 0.0% |
| 10 or more Apartments | 0 | 0.0% |
| Mobile Home / Other | 0 | 0.0% |
| Total | 486 | 100.0% |
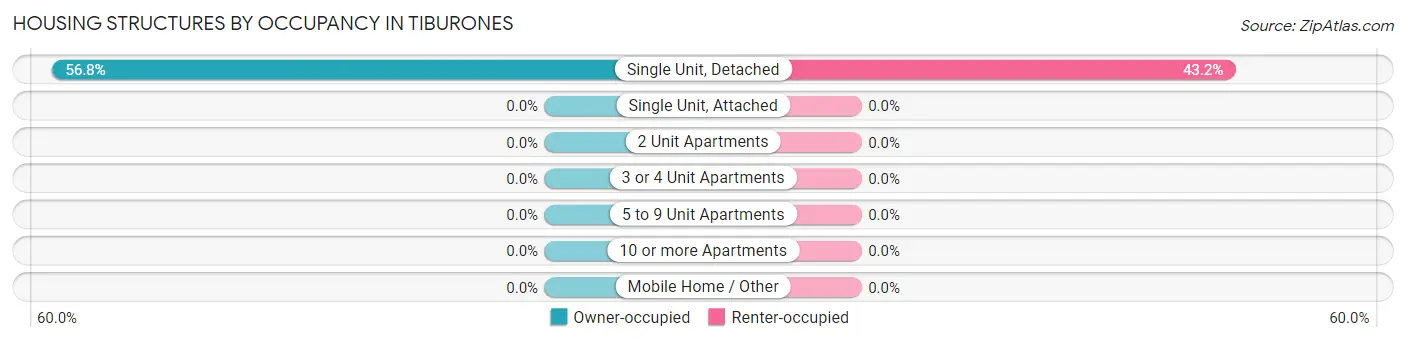
Housing Structures by Occupancy in Tiburones
| Structure Type | Owner-occupied | Renter-occupied |
| Single Unit, Detached | 276 (56.8%) | 210 (43.2%) |
| Single Unit, Attached | 0 (0.0%) | 0 (0.0%) |
| 2 Unit Apartments | 0 (0.0%) | 0 (0.0%) |
| 3 or 4 Unit Apartments | 0 (0.0%) | 0 (0.0%) |
| 5 to 9 Unit Apartments | 0 (0.0%) | 0 (0.0%) |
| 10 or more Apartments | 0 (0.0%) | 0 (0.0%) |
| Mobile Home / Other | 0 (0.0%) | 0 (0.0%) |
| Total | 276 (56.8%) | 210 (43.2%) |
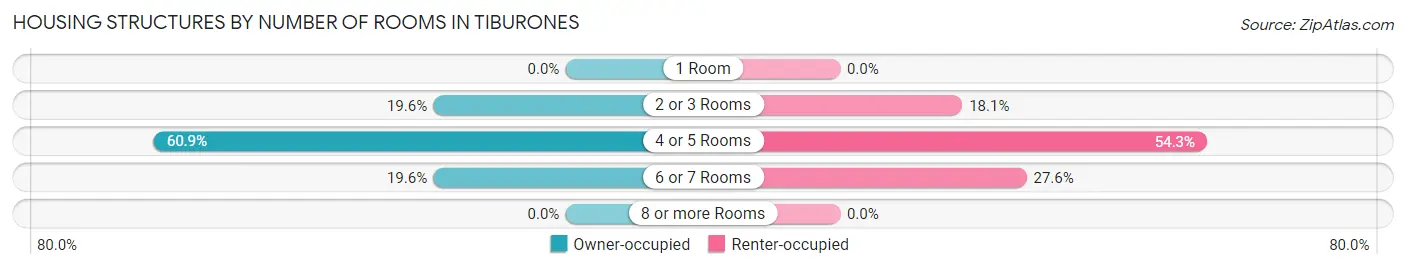
Housing Structures by Number of Rooms in Tiburones
| Number of Rooms | Owner-occupied | Renter-occupied |
| 1 Room | 0 (0.0%) | 0 (0.0%) |
| 2 or 3 Rooms | 54 (19.6%) | 38 (18.1%) |
| 4 or 5 Rooms | 168 (60.9%) | 114 (54.3%) |
| 6 or 7 Rooms | 54 (19.6%) | 58 (27.6%) |
| 8 or more Rooms | 0 (0.0%) | 0 (0.0%) |
| Total | 276 (100.0%) | 210 (100.0%) |
Housing Structure by Heating Type in Tiburones
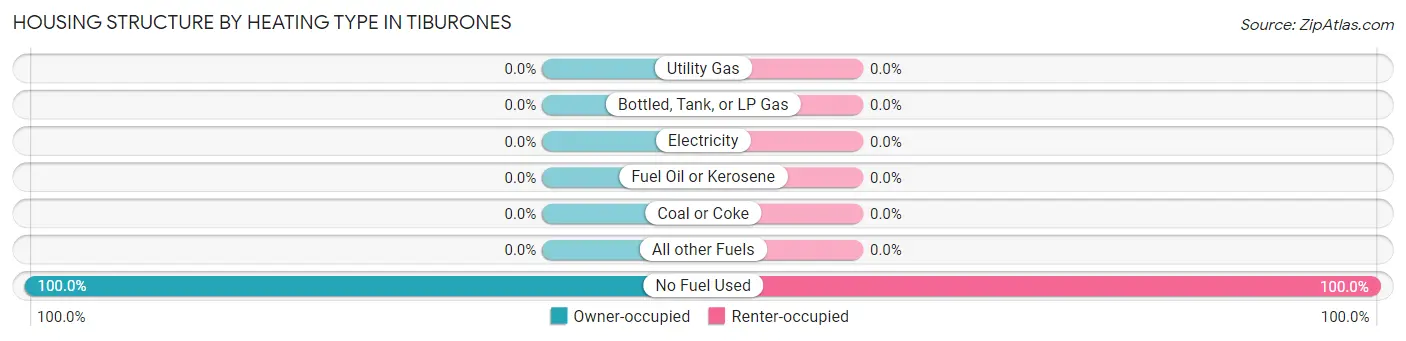
| Heating Type | Owner-occupied | Renter-occupied |
| Utility Gas | 0 (0.0%) | 0 (0.0%) |
| Bottled, Tank, or LP Gas | 0 (0.0%) | 0 (0.0%) |
| Electricity | 0 (0.0%) | 0 (0.0%) |
| Fuel Oil or Kerosene | 0 (0.0%) | 0 (0.0%) |
| Coal or Coke | 0 (0.0%) | 0 (0.0%) |
| All other Fuels | 0 (0.0%) | 0 (0.0%) |
| No Fuel Used | 276 (100.0%) | 210 (100.0%) |
| Total | 276 (100.0%) | 210 (100.0%) |
Household Vehicle Usage in Tiburones
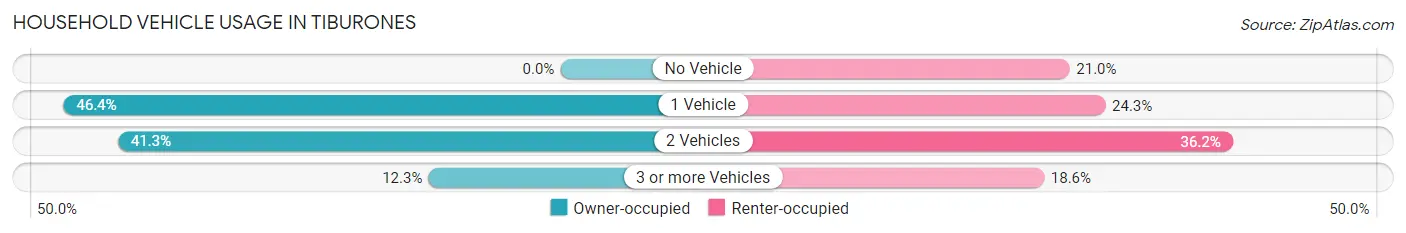
| Vehicles per Household | Owner-occupied | Renter-occupied |
| No Vehicle | 0 (0.0%) | 44 (20.9%) |
| 1 Vehicle | 128 (46.4%) | 51 (24.3%) |
| 2 Vehicles | 114 (41.3%) | 76 (36.2%) |
| 3 or more Vehicles | 34 (12.3%) | 39 (18.6%) |
| Total | 276 (100.0%) | 210 (100.0%) |
Real Estate & Mortgages in Tiburones
Real Estate and Mortgage Overview in Tiburones
| Characteristic | Without Mortgage | With Mortgage |
| Housing Units | 276 | 0 |
| Median Property Value | $75,600 | $0 |
| Median Household Income | $14,600 | $0 |
| Monthly Housing Costs | $143 | $0 |
| Real Estate Taxes | - | - |
Property Value by Mortgage Status in Tiburones
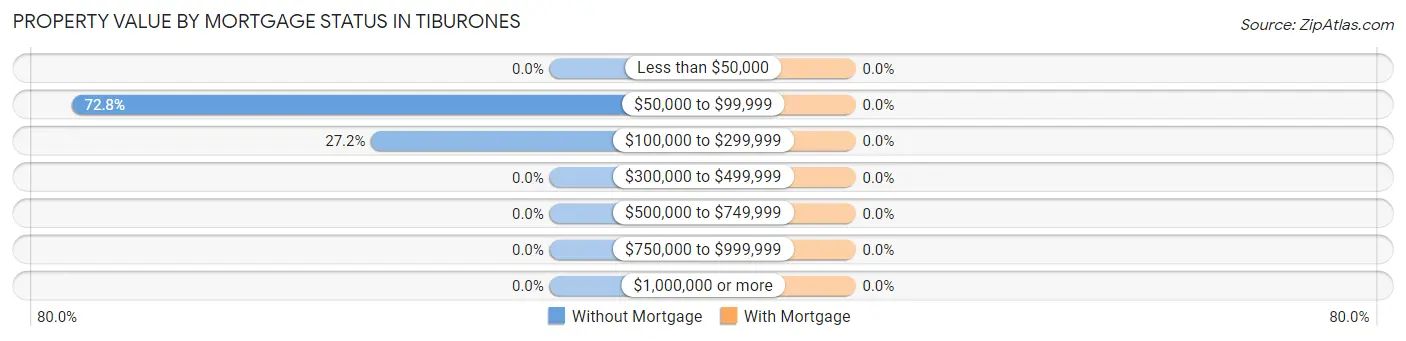
| Property Value | Without Mortgage | With Mortgage |
| Less than $50,000 | 0 (0.0%) | 0 (0.0%) |
| $50,000 to $99,999 | 201 (72.8%) | 0 (0.0%) |
| $100,000 to $299,999 | 75 (27.2%) | 0 (0.0%) |
| $300,000 to $499,999 | 0 (0.0%) | 0 (0.0%) |
| $500,000 to $749,999 | 0 (0.0%) | 0 (0.0%) |
| $750,000 to $999,999 | 0 (0.0%) | 0 (0.0%) |
| $1,000,000 or more | 0 (0.0%) | 0 (0.0%) |
| Total | 276 (100.0%) | 0 (0.0%) |
Household Income by Mortgage Status in Tiburones
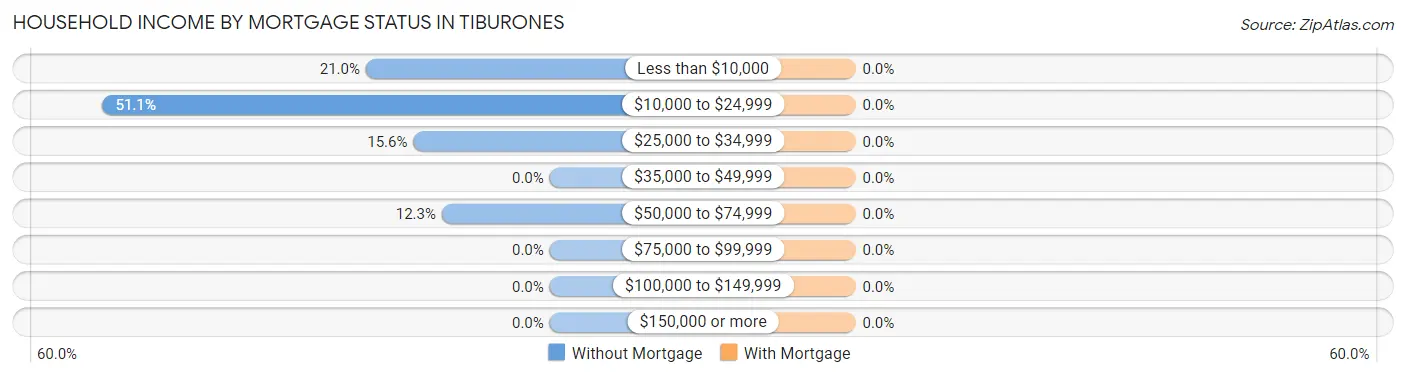
| Household Income | Without Mortgage | With Mortgage |
| Less than $10,000 | 58 (21.0%) | 0 (0.0%) |
| $10,000 to $24,999 | 141 (51.1%) | 0 (0.0%) |
| $25,000 to $34,999 | 43 (15.6%) | 0 (0.0%) |
| $35,000 to $49,999 | 0 (0.0%) | 0 (0.0%) |
| $50,000 to $74,999 | 34 (12.3%) | 0 (0.0%) |
| $75,000 to $99,999 | 0 (0.0%) | 0 (0.0%) |
| $100,000 to $149,999 | 0 (0.0%) | 0 (0.0%) |
| $150,000 or more | 0 (0.0%) | 0 (0.0%) |
| Total | 276 (100.0%) | 0 (0.0%) |
Property Value to Household Income Ratio in Tiburones
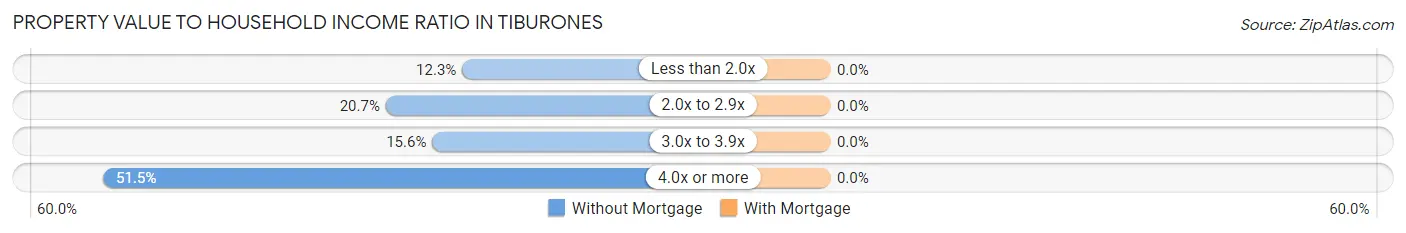
| Value-to-Income Ratio | Without Mortgage | With Mortgage |
| Less than 2.0x | 34 (12.3%) | 0 (0.0%) |
| 2.0x to 2.9x | 57 (20.6%) | 0 (0.0%) |
| 3.0x to 3.9x | 43 (15.6%) | 0 (0.0%) |
| 4.0x or more | 142 (51.4%) | 0 (0.0%) |
| Total | 276 (100.0%) | 0 (0.0%) |
Real Estate Taxes by Mortgage Status in Tiburones

| Property Taxes | Without Mortgage | With Mortgage |
| Less than $800 | 0 (0.0%) | 0 (0.0%) |
| $800 to $1,499 | 0 (0.0%) | 0 (0.0%) |
| $800 to $1,499 | 0 (0.0%) | 0 (0.0%) |
| Total | 276 (100.0%) | 0 (0.0%) |
Health & Disability in Tiburones
Health Insurance Coverage by Age in Tiburones
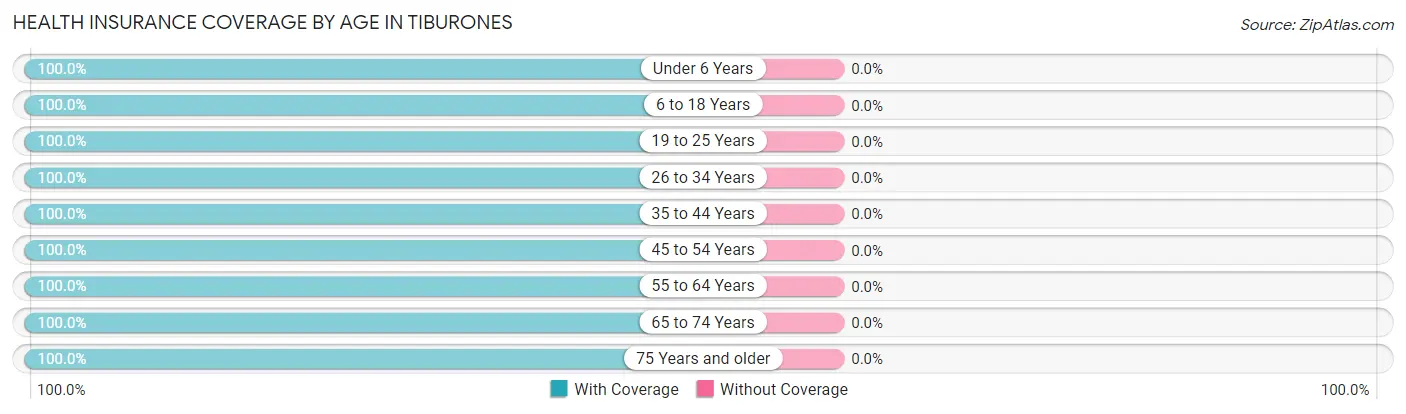
| Age Bracket | With Coverage | Without Coverage |
| Under 6 Years | 59 (100.0%) | 0 (0.0%) |
| 6 to 18 Years | 309 (100.0%) | 0 (0.0%) |
| 19 to 25 Years | 156 (100.0%) | 0 (0.0%) |
| 26 to 34 Years | 102 (100.0%) | 0 (0.0%) |
| 35 to 44 Years | 204 (100.0%) | 0 (0.0%) |
| 45 to 54 Years | 246 (100.0%) | 0 (0.0%) |
| 55 to 64 Years | 19 (100.0%) | 0 (0.0%) |
| 65 to 74 Years | 135 (100.0%) | 0 (0.0%) |
| 75 Years and older | 31 (100.0%) | 0 (0.0%) |
| Total | 1,261 (100.0%) | 0 (0.0%) |
Health Insurance Coverage by Citizenship Status in Tiburones
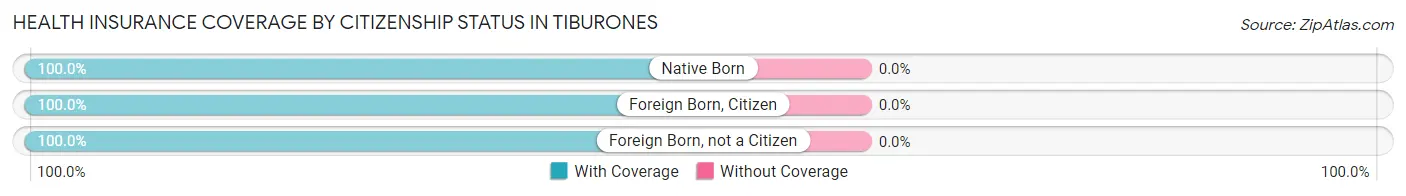
| Citizenship Status | With Coverage | Without Coverage |
| Native Born | 59 (100.0%) | 0 (0.0%) |
| Foreign Born, Citizen | 309 (100.0%) | 0 (0.0%) |
| Foreign Born, not a Citizen | 156 (100.0%) | 0 (0.0%) |
Health Insurance Coverage by Household Income in Tiburones
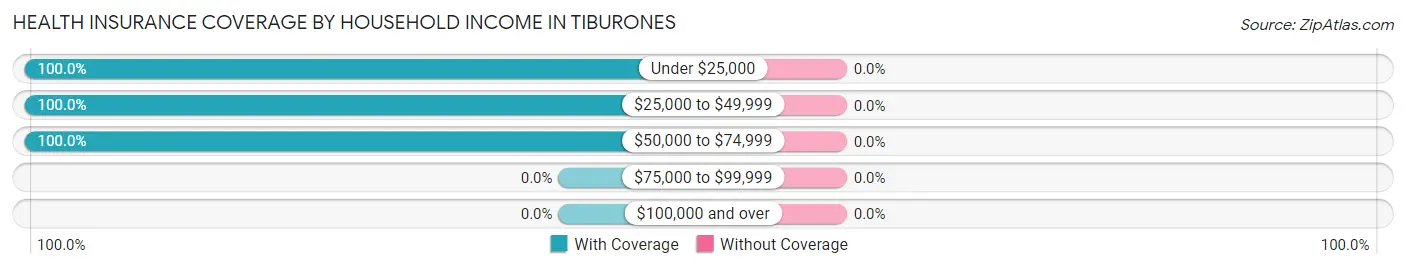
| Household Income | With Coverage | Without Coverage |
| Under $25,000 | 1,083 (100.0%) | 0 (0.0%) |
| $25,000 to $49,999 | 88 (100.0%) | 0 (0.0%) |
| $50,000 to $74,999 | 90 (100.0%) | 0 (0.0%) |
| $75,000 to $99,999 | 0 (0.0%) | 0 (0.0%) |
| $100,000 and over | 0 (0.0%) | 0 (0.0%) |
Public vs Private Health Insurance Coverage by Age in Tiburones
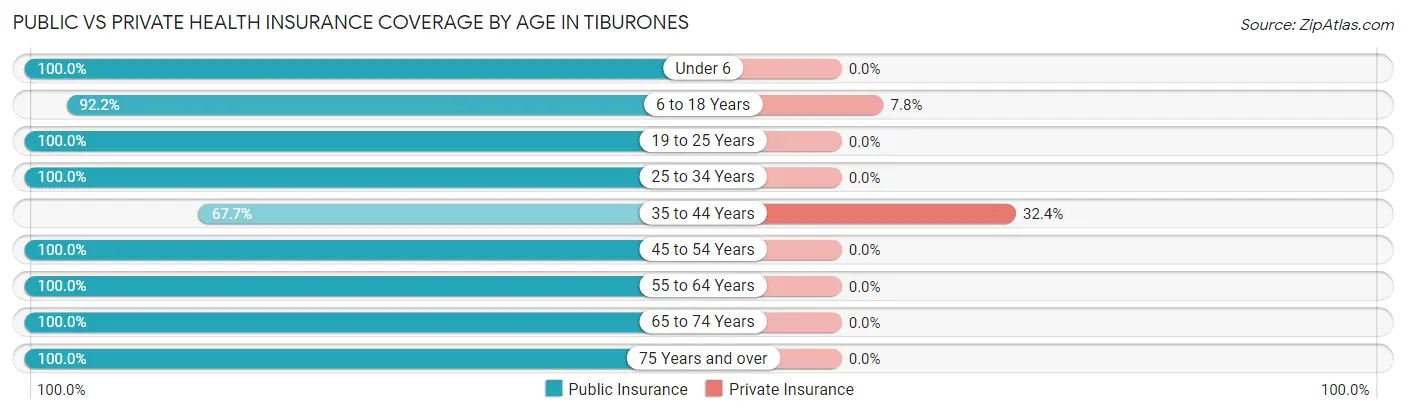
| Age Bracket | Public Insurance | Private Insurance |
| Under 6 | 59 (100.0%) | 0 (0.0%) |
| 6 to 18 Years | 285 (92.2%) | 24 (7.8%) |
| 19 to 25 Years | 156 (100.0%) | 0 (0.0%) |
| 25 to 34 Years | 102 (100.0%) | 0 (0.0%) |
| 35 to 44 Years | 138 (67.6%) | 66 (32.4%) |
| 45 to 54 Years | 246 (100.0%) | 0 (0.0%) |
| 55 to 64 Years | 19 (100.0%) | 0 (0.0%) |
| 65 to 74 Years | 135 (100.0%) | 0 (0.0%) |
| 75 Years and over | 31 (100.0%) | 0 (0.0%) |
| Total | 1,171 (92.9%) | 90 (7.1%) |
Disability Status by Sex by Age in Tiburones
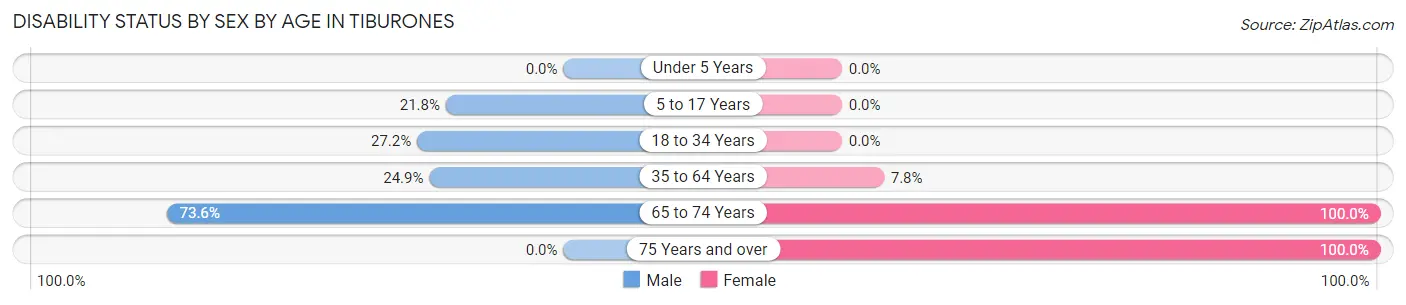
| Age Bracket | Male | Female |
| Under 5 Years | 0 (0.0%) | 0 (0.0%) |
| 5 to 17 Years | 48 (21.8%) | 0 (0.0%) |
| 18 to 34 Years | 44 (27.2%) | 0 (0.0%) |
| 35 to 64 Years | 56 (24.9%) | 19 (7.8%) |
| 65 to 74 Years | 67 (73.6%) | 44 (100.0%) |
| 75 Years and over | 0 (0.0%) | 31 (100.0%) |
Disability Class by Sex by Age in Tiburones
Disability Class: Hearing Difficulty
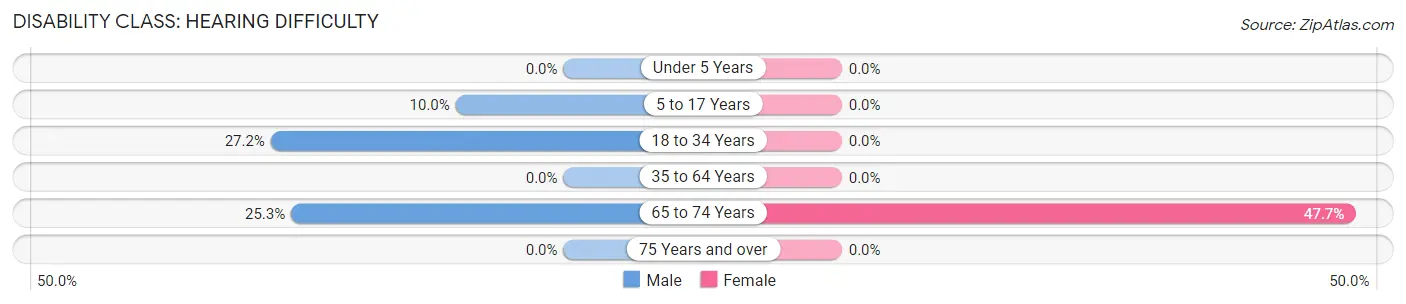
| Age Bracket | Male | Female |
| Under 5 Years | 0 (0.0%) | 0 (0.0%) |
| 5 to 17 Years | 22 (10.0%) | 0 (0.0%) |
| 18 to 34 Years | 44 (27.2%) | 0 (0.0%) |
| 35 to 64 Years | 0 (0.0%) | 0 (0.0%) |
| 65 to 74 Years | 23 (25.3%) | 21 (47.7%) |
| 75 Years and over | 0 (0.0%) | 0 (0.0%) |
Disability Class: Vision Difficulty
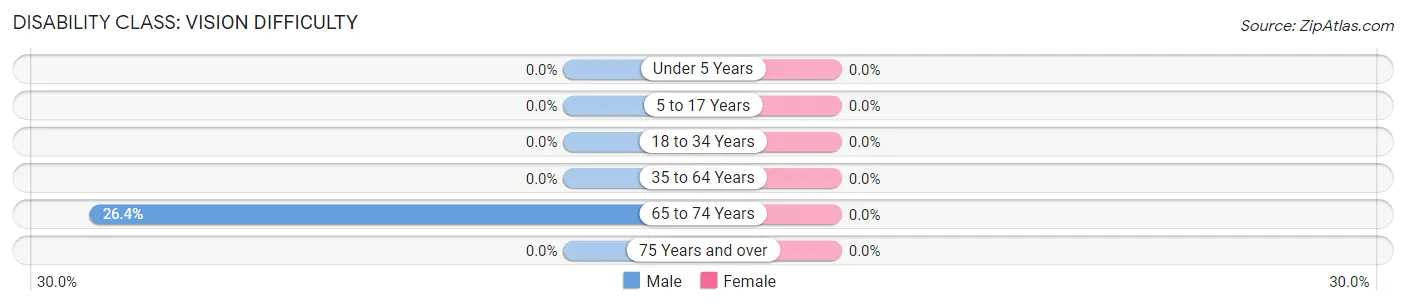
| Age Bracket | Male | Female |
| Under 5 Years | 0 (0.0%) | 0 (0.0%) |
| 5 to 17 Years | 0 (0.0%) | 0 (0.0%) |
| 18 to 34 Years | 0 (0.0%) | 0 (0.0%) |
| 35 to 64 Years | 0 (0.0%) | 0 (0.0%) |
| 65 to 74 Years | 24 (26.4%) | 0 (0.0%) |
| 75 Years and over | 0 (0.0%) | 0 (0.0%) |
Disability Class: Cognitive Difficulty
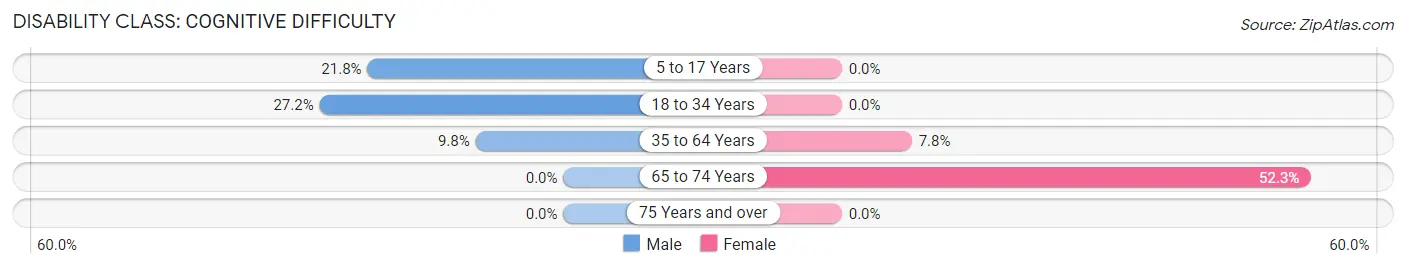
| Age Bracket | Male | Female |
| 5 to 17 Years | 48 (21.8%) | 0 (0.0%) |
| 18 to 34 Years | 44 (27.2%) | 0 (0.0%) |
| 35 to 64 Years | 22 (9.8%) | 19 (7.8%) |
| 65 to 74 Years | 0 (0.0%) | 23 (52.3%) |
| 75 Years and over | 0 (0.0%) | 0 (0.0%) |
Disability Class: Ambulatory Difficulty
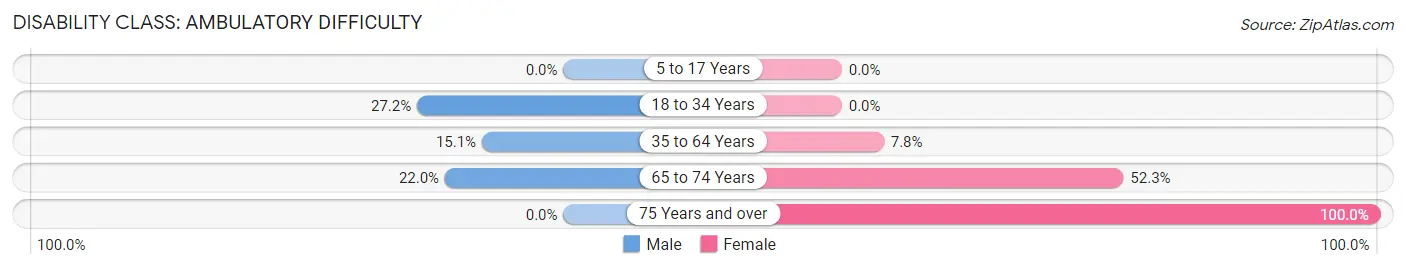
| Age Bracket | Male | Female |
| 5 to 17 Years | 0 (0.0%) | 0 (0.0%) |
| 18 to 34 Years | 44 (27.2%) | 0 (0.0%) |
| 35 to 64 Years | 34 (15.1%) | 19 (7.8%) |
| 65 to 74 Years | 20 (22.0%) | 23 (52.3%) |
| 75 Years and over | 0 (0.0%) | 31 (100.0%) |
Disability Class: Self-Care Difficulty
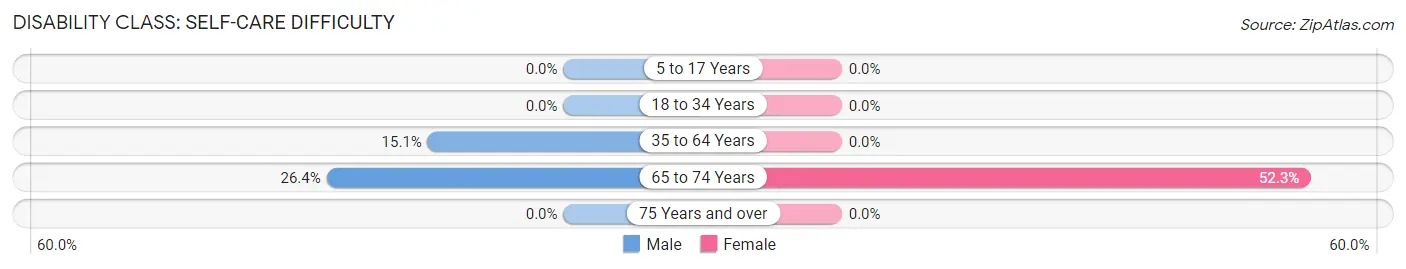
| Age Bracket | Male | Female |
| 5 to 17 Years | 0 (0.0%) | 0 (0.0%) |
| 18 to 34 Years | 0 (0.0%) | 0 (0.0%) |
| 35 to 64 Years | 34 (15.1%) | 0 (0.0%) |
| 65 to 74 Years | 24 (26.4%) | 23 (52.3%) |
| 75 Years and over | 0 (0.0%) | 0 (0.0%) |
Technology Access in Tiburones
Computing Device Access in Tiburones
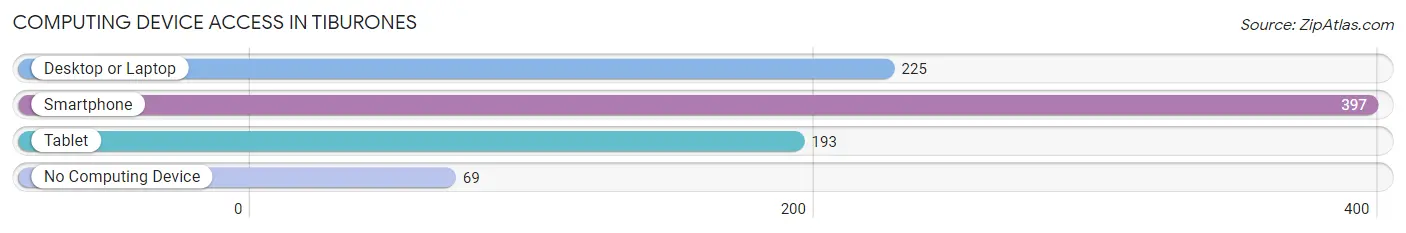
| Device Type | # Households | % Households |
| Desktop or Laptop | 225 | 46.3% |
| Smartphone | 397 | 81.7% |
| Tablet | 193 | 39.7% |
| No Computing Device | 69 | 14.2% |
| Total | 486 | 100.0% |
Internet Access in Tiburones
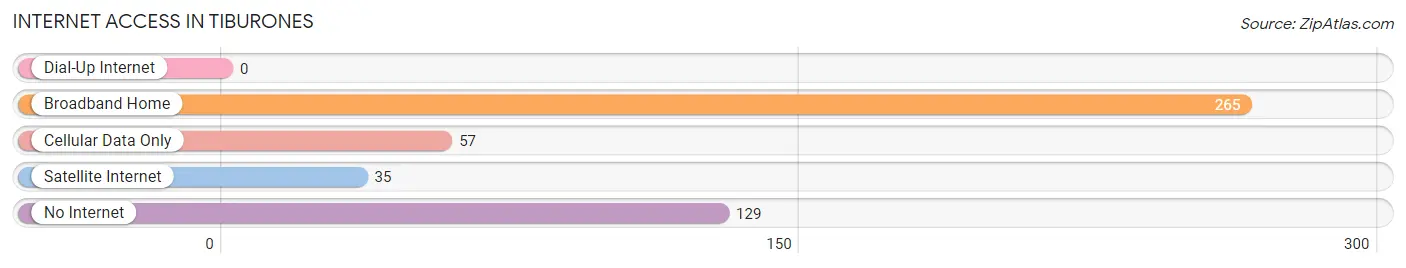
| Internet Type | # Households | % Households |
| Dial-Up Internet | 0 | 0.0% |
| Broadband Home | 265 | 54.5% |
| Cellular Data Only | 57 | 11.7% |
| Satellite Internet | 35 | 7.2% |
| No Internet | 129 | 26.5% |
| Total | 486 | 100.0% |
Tiburones Summary
Tiburones is a municipality located in the northeast corner of Puerto Rico, bordered by the Atlantic Ocean to the north, the municipality of Loíza to the east, the municipality of Canóvanas to the south, and the municipality of Carolina to the west. It is part of the San Juan-Caguas-Guaynabo Metropolitan Statistical Area. As of the 2010 census, the population of Tiburones was 8,845.
History
The area now known as Tiburones was originally inhabited by the Taíno Indians. The first European settlers arrived in the area in the early 16th century, and the area was part of the municipality of Loíza until 1824, when it was established as its own municipality.
The name Tiburones comes from the Spanish word for “sharks”, as the area was known for its abundance of sharks in the waters off the coast.
Geography
Tiburones is located in the northeast corner of Puerto Rico, bordered by the Atlantic Ocean to the north, the municipality of Loíza to the east, the municipality of Canóvanas to the south, and the municipality of Carolina to the west. It is part of the San Juan-Caguas-Guaynabo Metropolitan Statistical Area.
The municipality covers an area of 8.9 square miles (23.1 km2), and is divided into two wards: Tiburones Pueblo and Tiburones Playa. The highest point in the municipality is Cerro La Torre, which has an elevation of 545 feet (166 m).
Economy
The economy of Tiburones is largely based on tourism, as the municipality is home to several popular beaches, including Playa de Tiburones, Playa de Punta Salinas, and Playa de Punta Salinas. The municipality also has several hotels and resorts, as well as restaurants and bars.
In addition to tourism, Tiburones is also home to several small businesses, including a few small-scale manufacturing companies. The municipality also has a few agricultural operations, including a few small-scale farms.
Demographics
As of the 2010 census, the population of Tiburones was 8,845, with a population density of 990.3 people per square mile (382.3/km2). The racial makeup of the municipality was 79.2% White, 12.2% Black or African American, 0.3% Native American, 0.7% Asian, 0.1% Pacific Islander, and 6.5% from two or more races.
The median household income in Tiburones was $17,845, and the median family income was $20,938. The per capita income was $9,845. About 24.3% of the population was below the poverty line.
The population of Tiburones is largely Roman Catholic, with about 85.3% of the population identifying as Catholic. Other religious affiliations include Protestantism (7.2%), Jehovah’s Witnesses (2.2%), and other religions (5.3%).
Common Questions
What is Per Capita Income in Tiburones?
Per Capita income in Tiburones is $5,835.
What is the Median Family Income in Tiburones?
Median Family Income in Tiburones is $10,993.
What is the Median Household income in Tiburones?
Median Household Income in Tiburones is $11,804.
What is Inequality or Gini Index in Tiburones?
Inequality or Gini Index in Tiburones is 0.44.
What is the Total Population of Tiburones?
Total Population of Tiburones is 1,261.
What is the Total Male Population of Tiburones?
Total Male Population of Tiburones is 730.
What is the Total Female Population of Tiburones?
Total Female Population of Tiburones is 531.
What is the Ratio of Males per 100 Females in Tiburones?
There are 137.48 Males per 100 Females in Tiburones.
What is the Ratio of Females per 100 Males in Tiburones?
There are 72.74 Females per 100 Males in Tiburones.
What is the Median Population Age in Tiburones?
Median Population Age in Tiburones is 35.1 Years.
What is the Average Family Size in Tiburones
Average Family Size in Tiburones is 2.9 People.
What is the Average Household Size in Tiburones
Average Household Size in Tiburones is 2.6 People.
How Large is the Labor Force in Tiburones?
There are 399 People in the Labor Forcein in Tiburones.
What is the Percentage of People in the Labor Force in Tiburones?
41.4% of People are in the Labor Force in Tiburones.
What is the Unemployment Rate in Tiburones?
Unemployment Rate in Tiburones is 39.1%.